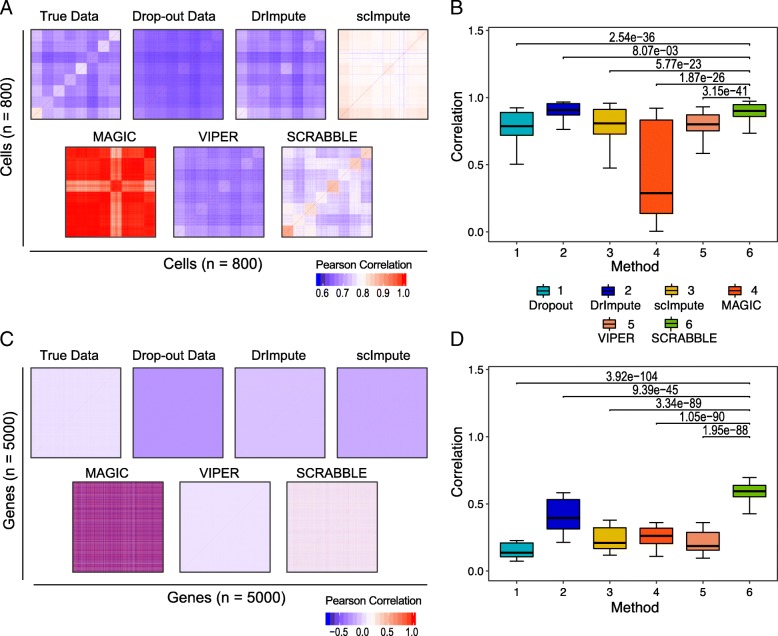
Fig. 5.
SCRABBLE better preserves the true cell-cell and gene-gene relationships in the data. a Representative cell-cell correlation matrices using true, dropout, and imputed data. The dropout rate is 72%. Values are Pearson correlation coefficients. b Pearson correlation between the cell-cell correlation matrices based on true and dropout/imputed data. Boxplots represent 100 sets of simulated data. P values are based on Student’s t test. c Representative gene-gene correlation matrices using true, dropout, and imputed data. d Pearson correlation between the gene-gene correlation matrices based on true and dropout/imputed data

