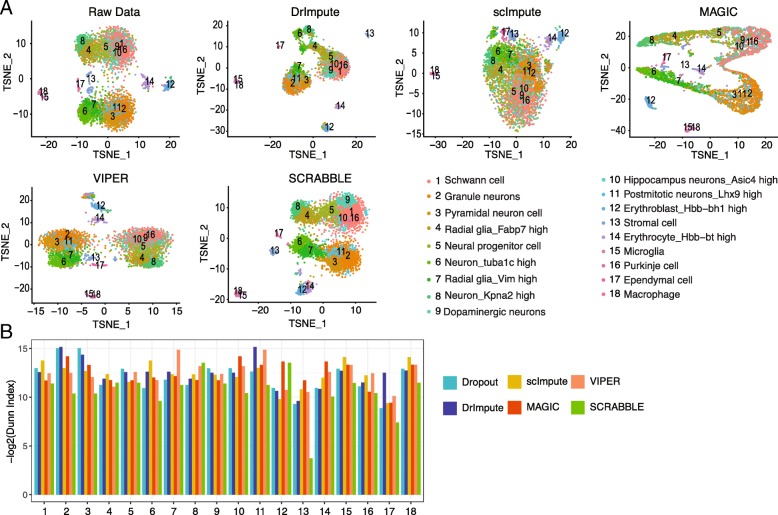
Fig. 7.
SCRABBLE improves the clustering analysis. a Clustering results using un-imputed and imputed data by various methods. scRNA-seq data was clustered using K-nearest neighbor clustering and visualized using t-SNE. The number of clusters (K) was based on the ones provided by the authors. Cell type of each cluster was identified based on marker genes provided by the authors. b Quantification of cluster quality using the Dunn index

