Fig. 1.
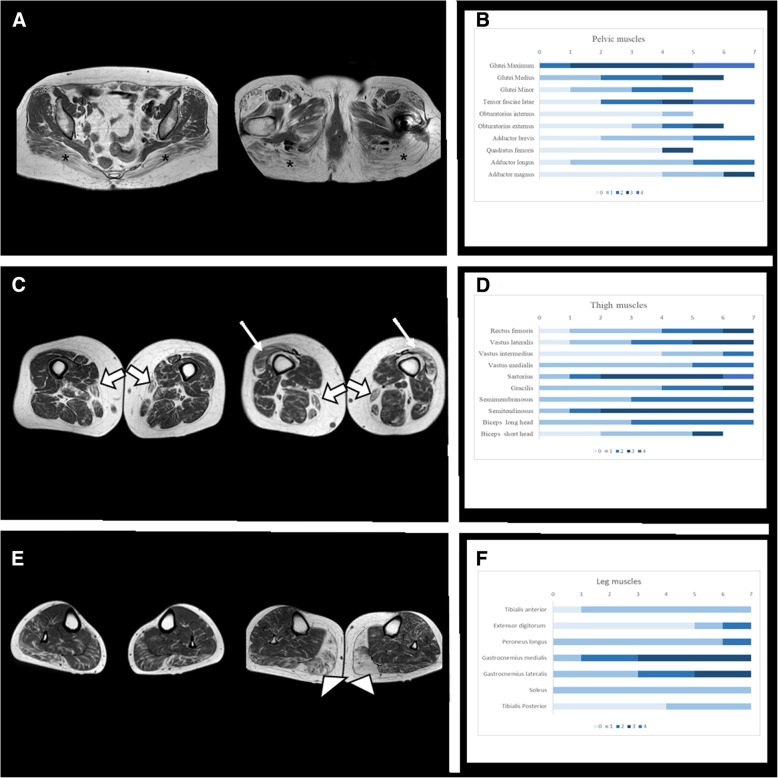
Axial T1 muscle MRI and bar charts with Mercuri Visual Scale (MVS) distribution for 7 patients and per anatomical region. a, Axial T1 muscle MRI in pelvis: These two consecutive slices from different patients are showing that the gluteus maximus (marked with asterisk) is the most affected muscle. Tensor fascia latae is affected while obturator and quatratus femoris are less affected. b, Bar chart MVS fat replacement in pelvis: MVS (0: no fat replacement, 4: the muscle is completely replaced) for all patients. Gluteus maximus is the most affected muscle, followed by tensor fascia latae. c, Axial T1 muscle MRI in thighs: These two slices from two different patients are showing the fat replacement of sartorius (wide white arrow) and vastus lateralis (thin white arrow). Other muscles like semitendinosus, semimembranosus and gracilis are also moderately affected. d, Bar chart MVS fat replacement in thighs: MVS for all patients. Sartorius, semimembranosus, semitendinosus, gracilis and vastus lateralis are the most affected muscles. Sartorius and gracilis are affected in all patients. e, Axial T1 muscle MRI in legs: These two slices from two different patients are showing the fat replacement of gastrocnemius medialis (white arrow head). Gastrocnemius lateralis and soleus are also moderately affected. Tibialis anterior and tibialis posterior are the least affected. f, Bar chart MVS fat replacement in legs: MVS for all patients. Gastrocnemius medialis and lateralis are the most affected muscles in legs. Tibialis anterior, extensoris digitorum and tibialis posterior are the least affected muscles

