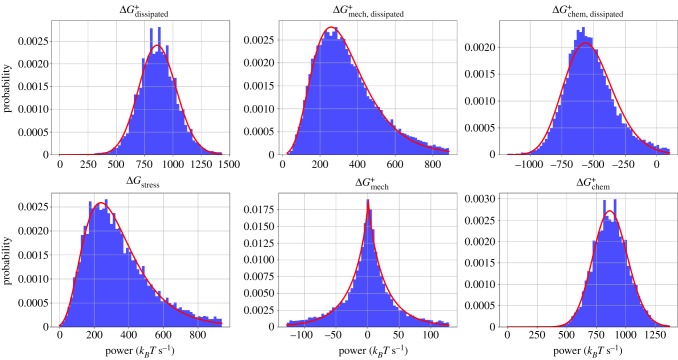
Figure 5.
Histograms and fitted probability distribution functions for six tracked quantities. For each histogram, the full trajectory for each of 10 runs is combined into a single dataset. A lognormal distribution was used to fit the histograms of and , a generalized normal distribution was used to fit , and the rest were fitted with gamma distributions. All distributions are fitted using the SciPy package to determine shape, scale and location parameters [45]. Quantities were made positive or negative in order to produce the best fits. (Online version in colour.)

