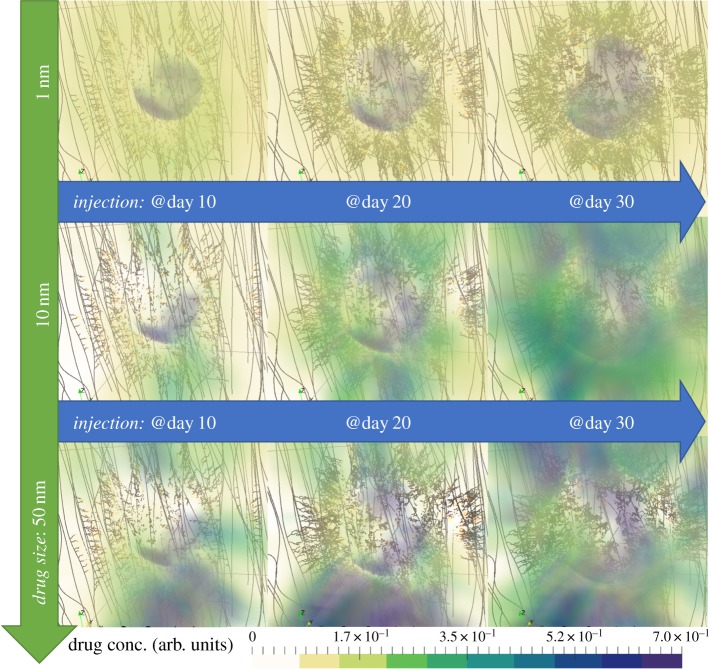
Figure 3.
Snapshots of the in silico predicted drug distribution for the three drug cases (in rows). Each column corresponds to time-instants of tumour response to treatment 5 days after the time of drug injection. All simulation results correspond to the high porosity extracellular matrix case. The coloured cloud represents the drug concentration (as a fraction of the total drug administered) that has been associated with the tumour and the host tissue. For illustration purposes, the internal structure of the three-dimensional domain of analysis is transparent, while the microvascular network is coloured such that the well-perfused vessels are shown dark whereas the poorly perfused vessels are lightly coloured. (Online version in colour.)

