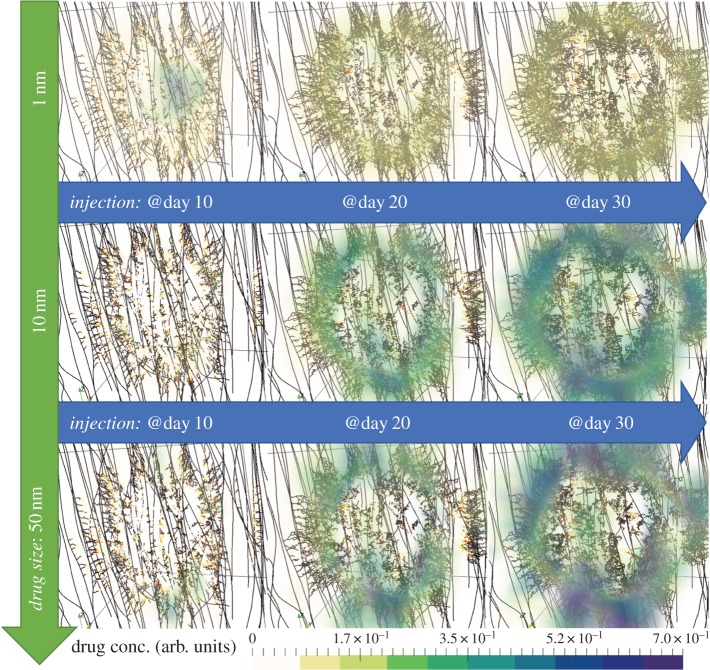
Figure 4.
Snapshots of the in silico predicted drug distribution and the microvascular network for the three drug cases (in rows) and for the three injection times (in columns). All simulation results correspond to the low porosity extracellular matrix case. For detailed interpretation of the graphics, the reader is referred to the caption of figure 3. (Online version in colour.)

