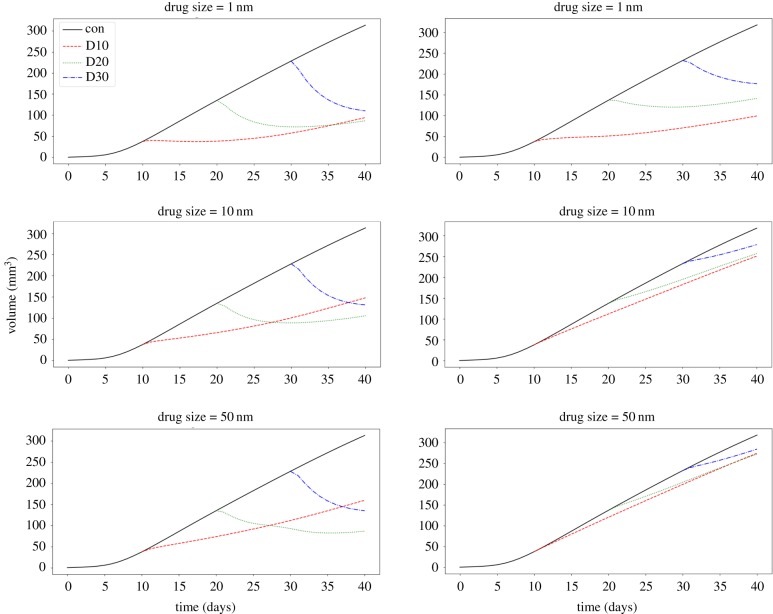
Figure 5.
Line plots of the relative tumour volume (V = Vol.(t)/Vol.(t = 0) − 1) versus time, for control simulations (black solid lines), and treatments administered at days 10, 20 and 30 (D10, D20, D30; coloured dashed lines). The results in the left column correspond to high hydraulic conductivity (‘high porosity’), Kint, and the results in the right column correspond to low hydraulic conductivity (‘low porosity’). (Online version in colour.)

