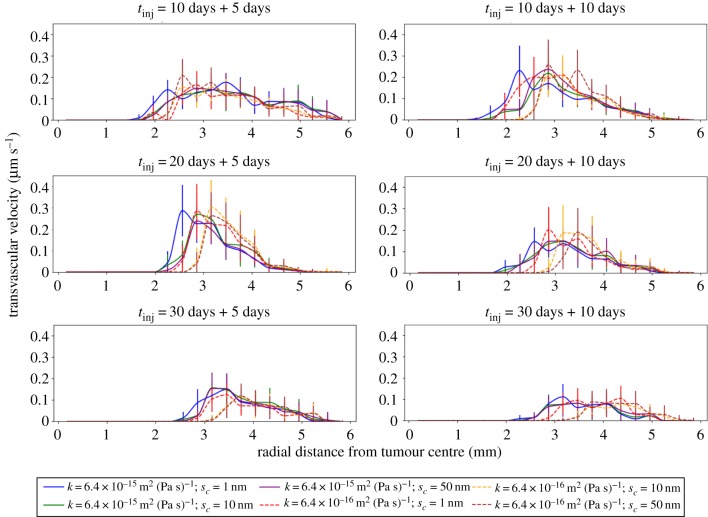
Figure 6.
Line plots of the mean transvascular velocity (TRV) as a function of the radial distance from the centre of the tumour, with standard errors. Each row corresponds to a different time of injection, while each column depicts the TRV radial distribution 5 days and 10 days after drug administration. The legend lists the various simulation combinations based on the hydraulic conductivity of the ECM (κ) and the drug size (sc). (Online version in colour.)

