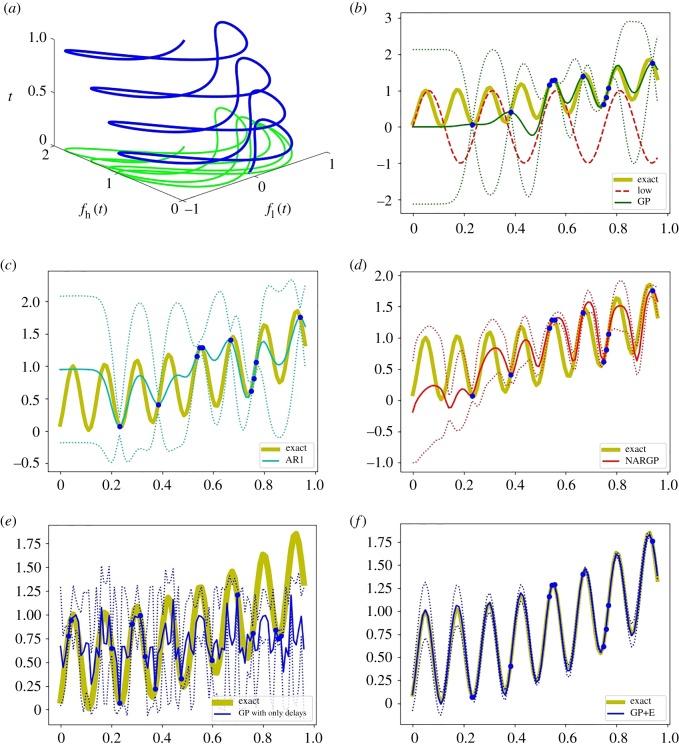
Figure 3.
Examples of phase shifted oscillations. (a) Dependency between fl and fh with t. (b–f) The high-fidelity function (the yellow curve) versus posterior means with 2 s.d. (dashed lines) of 5 compared methods with 10 high-fidelity data points and 100 uniformly distributed low-fidelity data points. (b) GP (Kriging) and low-fidelity data (the red-dashed curve). (c) Auto-regressive GP (AR1 or coKriging). (d) Nonlinear auto-regressive GP (NARGP). (e) GP in the higher-dimensional space with only delays (fl(t), fl(t − τ), fl(t − 2τ)). (f) GP in the higher-dimensional space (GP+E), using (t, fl(t), fl(t − τ), fl(t − 2τ)). (Online version in colour.)

