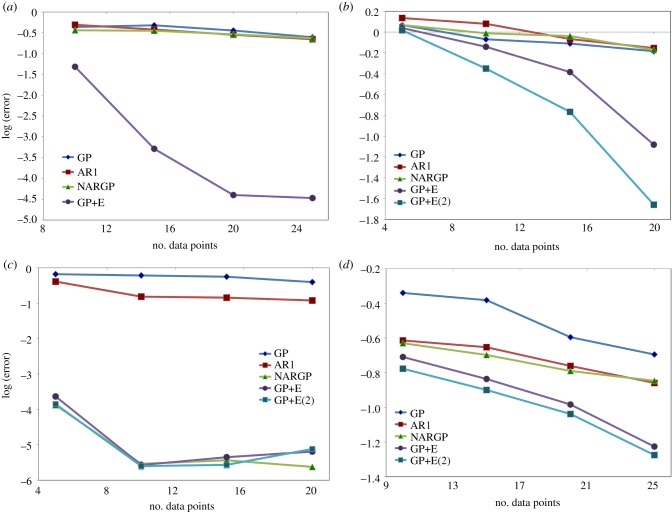
Figure 4.
Log L2 error (y-axis) of prediction for the high-fidelity model by GP (Kriging), AR1 (coKriging), NARGP and GPs in the higher-dimensional space (GP+E and GP+E(2)) with respect to the number of high-fidelity data points (x-axis). The error is obtained by averaging 10 trials of random data selections. In the Hodgkin–Huxley models, we predict action potential for the high-fidelity model. (a) Phase shifted oscillations, (b) different periodicity, (c) models with discontinuities, (d) the Hodgkin–Huxley models. (Online version in colour.)

