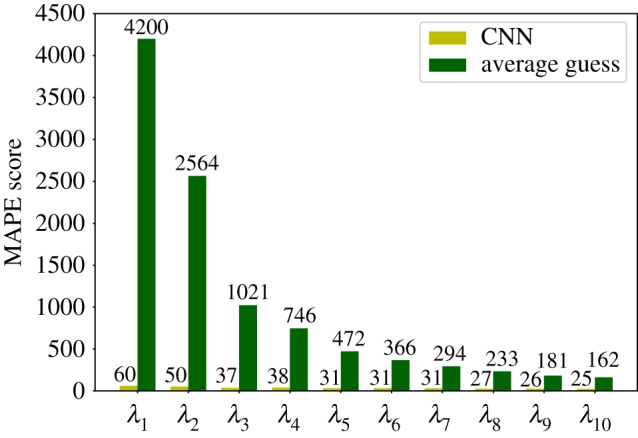
Figure 7.

Comparison of the MAPE score as obtained from the CNN trained in the present work (light green bars) and a reference, maximally uninformative random model (dark green bars). The values attained by each model for each eigenvalue are indicated above the bar.
