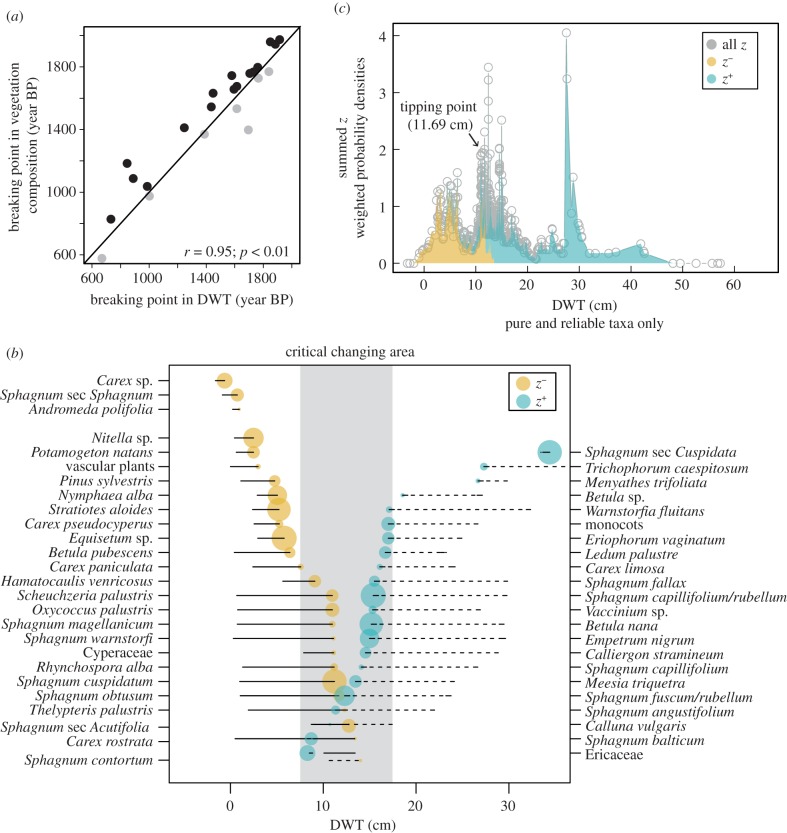
Figure 1.
Tipping point in vegetation community composition. (a) Biplot of tipping points in vegetation composition (NMDS axis 1) versus tipping points in DWT at each site. Black dots above the 1 : 1 line indicate vegetation tipping points that followed a DWT tipping point; grey dots below the 1 : 1 line indicate the opposite. (b) Plant species' change points along the water-level gradient (purity greater than 99%, p < 0.05 in greater than 99% bootstraps) showing 95% bootstrap percentiles; dot colours show the species that either increase (z+) or decrease (z−) in abundance along the DWT gradient. Critical changing area reflects the 5%–95% bootstrap percentile range (in grey) of community change point (see subset c). (c) Plant community change point along the DWT gradient showing community threshold (dotted line) at max([sum(z−)]) and 5–95% bootstrap percentile range. [sum(z−)] values represent the sum of responses for each possible change point along the gradient. (Online version in colour.)

