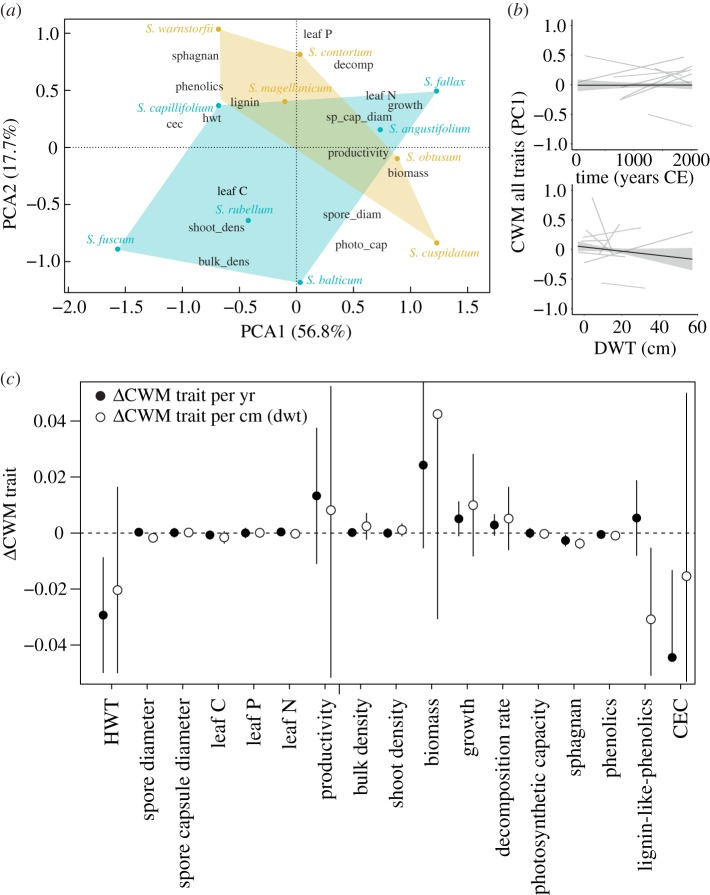
Figure 2.
Functional traits of Sphagnum from the macrofossil record. (a) Functional space of each Sphagnum species based on a PCA analysis computed on Sphagnum functional traits. Yellow colour: species below the plant community tipping point; blue colour: species above the plant community tipping point identified in TITAN. (b) Relationship between time, DWT and averaged Sphagnum community traits. Species scores from the PCA shown in (a) were used as a synthetic Sphagnum ‘trait’ to calculate Sphagnum averaged community traits. Lines are mixed-effect model fits for each site (thin grey line) or across sites (thick lines with bands indicating 95% confidence interval). (c) Moisture sensitivity of each community trait (CWM). Circles represent the mean water table sensitivity across six sites based on a Bayesian linear mixed model (see Methods); Słowińskie Błoto was removed from the analysis because it was the only site covering a large DWT gradient. Error bars are a 95% credible interval on the mean and indicate that the DWT–trait relationship differed from zero. Black circles indicate a DWT–trait relationship that differed from zero, while white circles indicate the opposite. (Online version in colour.)

