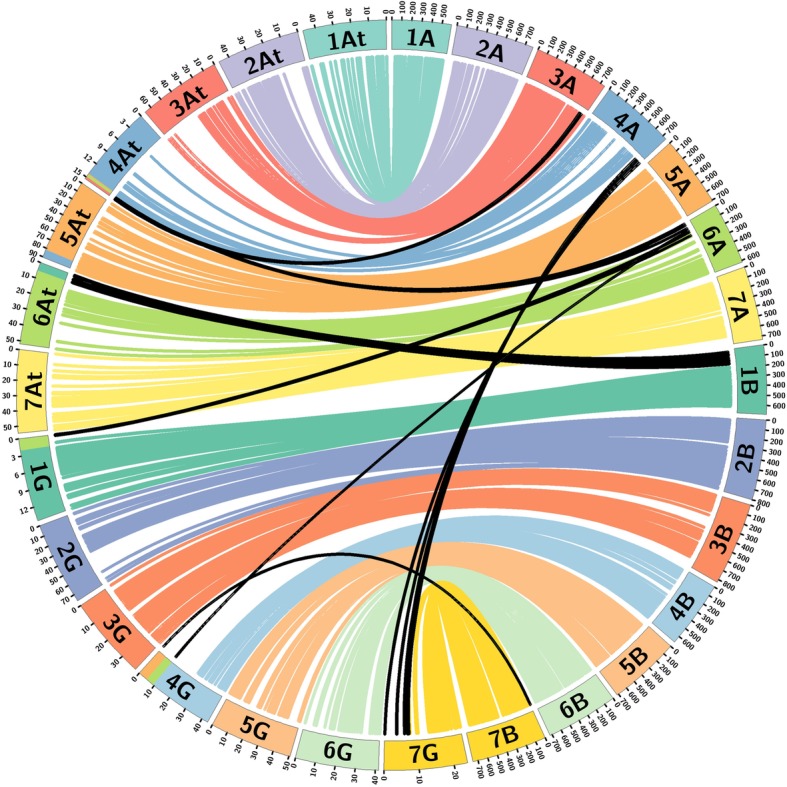
Fig. 5.

Comparison of the At and G genomes of T. timopheevii and the A and B genomes of wheat, respectively, showing significant synteny and inter- and intra-genomic translocations. Chromosomes from both genome groups (At/A and G/B) are represented by differently coloured ideograms but chromosomes from the same homoeologous group in T. timopheevii and wheat are represented by the same colour. Ticks on the T. timopheevii genomes show the ideogram size in cM whereas those on the wheat genomes show the ideogram size in Mbp. BLAST results are represented by differently coloured links between the map positions of the markers on the genetic map of T. timopheevii and their corresponding physical positions on the wheat genome. Syntenic links are of the same colour as the homoeologous chromosomes which are linked whereas black links indicate where the BLAST hit was to a non-homoeologous chromosome
