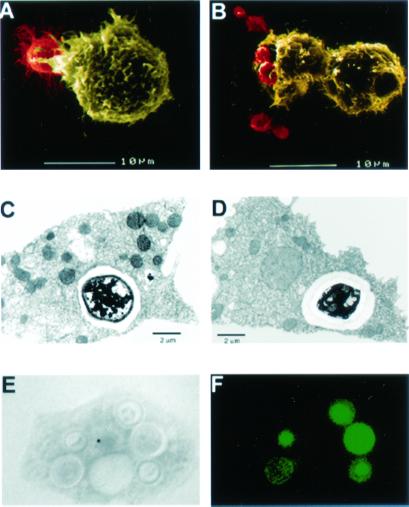
Figure 2.
Microscopy of Ac incubated with Cn in PYG media. Each field is representative of amoeba/Cn interactions at a given time. For both SEM figures, Cn cells are depicted in red and Ac cells are depicted in yellow: (A) SEM 30-min postincubation with Cn 24067 and (B) SEM 90-min postincubation with Cn 24067. (C) TEM 24-h postincubation with Cn 3501. (D) TEM 1.5-h postincubation with Cn 24067. (E and F) Corresponding light microscopy (E) and immunofluorescent (F) pictures 2 h postincubation of Ac with FITC-labeled Cn 3501. (Magnifications: ×1,000.)

