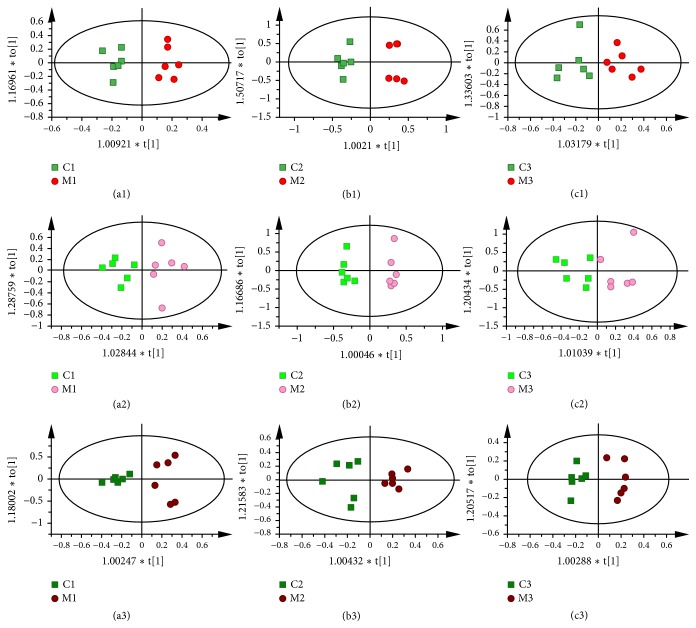
Figure 3.
OPLS-DA scores plots from stomach of rats in C1 and M1 group ((a1) R2X=0.39cum, R2Y=0.947cum, and Q2=0.733cum); stomach of rats in C2 and M2 group ((b1) R2X=0.831cum, R2Y=0.962cum, and Q2=0.539cum); stomach of rats in C3 and M3 group ((c1) R2X=0.499cum, R2Y=0.797cum, and Q2=0.379cum); liver of rats in C1 and M1 group ((a2) R2X=0.583cum, R2Y=0.832cum, and Q2=0.575cum); liver of rats in C2 and M2 group ((b2) R2X=0.888cum, R2Y=0.98cum, and Q2=0.819cum); liver of rats in C3 and M3 group ((c2) R2X=0.777cum, R2Y=0.744cum, and Q2=0.528cum); kidney of rats in C1 and M1 group ((a3) R2X=0.789cum, R2Y=0.9cum, and Q2=0.823cum); kidney of rats in C2 and M2 group ((b3) R2X=0.688cum, R2Y=0.862cum, and Q2=0.66cum); kidney of rats in C3 and M3 group ((c3) R2X=0.545cum, R2Y=0.926cum, and Q2=0.786cum).

