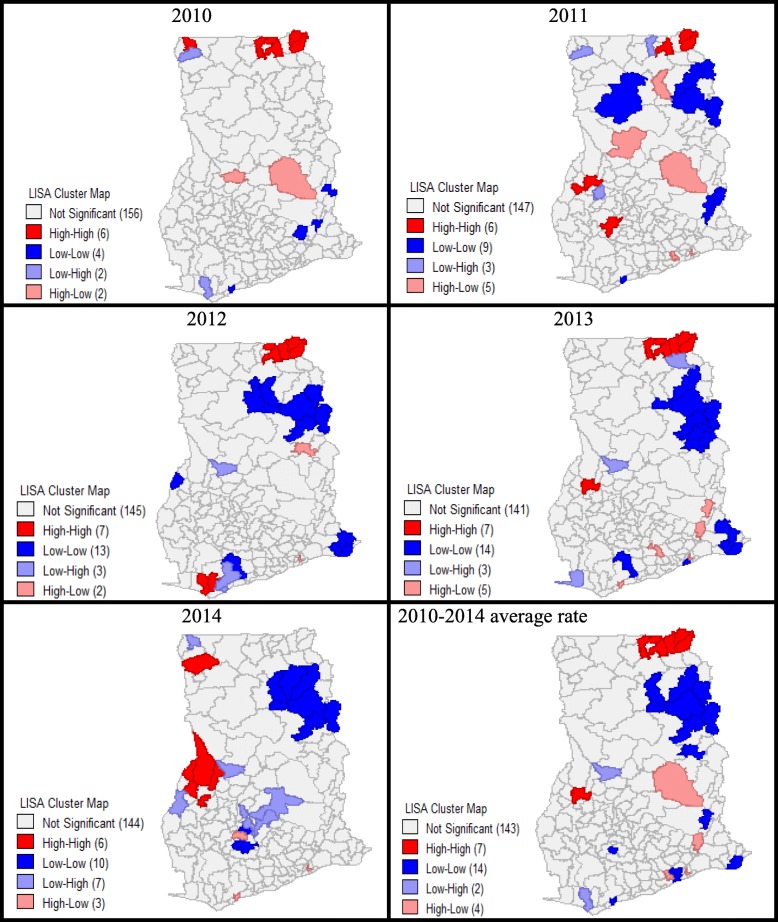
Fig. 6.
Local Moran’s I cluster-outlier maps of malaria incidence for the years 2010 to 2014 and the average incidence with statistical inference based on Monte Carlo randomisation test at 999 permutations, showing significant pseudo p < 0.05 clusters of High-High (hotspot) and Low-Low (colspot); and outliers High-Low and Low-High. LISA: Local Indicator of Spatial Association. The maps were generated using GeoDa statistical software version 1.12

