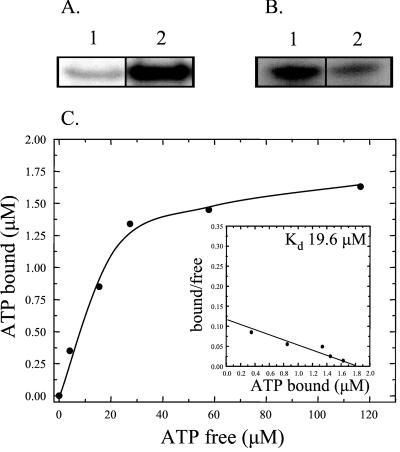
Figure 2.
Binding and phosphorylation of PAS-A by ATP. (A) PAS-A was incubated with [α-32P]ATP and kept in the dark (lane 1) or exposed to UV light (lane 2), followed by SDS/PAGE with subsequent autoradiography. (B) Phosphorylation of PAS-A with [γ-32P]ATP (lane 1) or [γ-32P]GTP (lane 2). Labeled protein was visualized by autoradiography after SDS/PAGE. (C) Binding curve of [α-32P]ATP binding to PAS-A was obtained by nonlinear regression analysis of the raw data followed by Scatchard plot transformation of the data (Inset).

