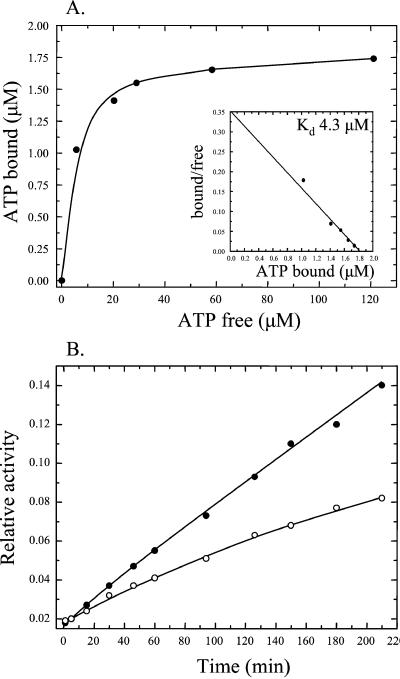
Figure 5.
ATP binding and catalytic activity of PAS-A C75A. (A) The binding curve of [α-32P]ATP binding to PAS-A C75A was obtained by nonlinear regression analysis of the raw data followed by Scatchard plot transformation (Inset). (B) Catalytic activity of PAS-A. Wild-type PAS-A (100 μM, ●) or PAS-A C75A (100 μM, ○) was incubated with 1 mM [α-32P]ATP in the presence of 1 mM unlabeled ADP, and samples were removed at time intervals and the reaction was stopped by freezing in a dry ice/ethanol bath. Reaction products were analyzed by TLC and quantified by phosphorimaging. The relative amount of [α-32P]ADP formed with time is expressed as the ratio of [α-32P]ADP to [α-32P]ATP.

