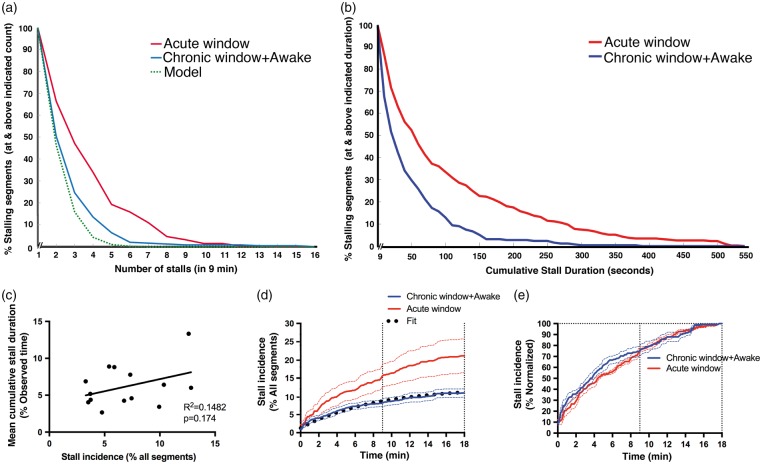
Figure 2.
Temporal dynamics of capillary stalls. (a–b) Distribution of stall counts and cumulative stall durations of each segment in acute (anesthetized) and chronic (awake) cranial windows during a 9-min observation. Model prediction is seen as a green dotted curve in (a). (c) Lack of correlation of stall incidence with average cumulative stall duration (per ROI) for awake animal recordings.(d–e) Identified percentage of stalls relative to all observed segments (d) or all identified stalling segments (e) as a function of observation time (imaging time extended to 18 min). Exponential fit is seen as black dotted curve in (d).

