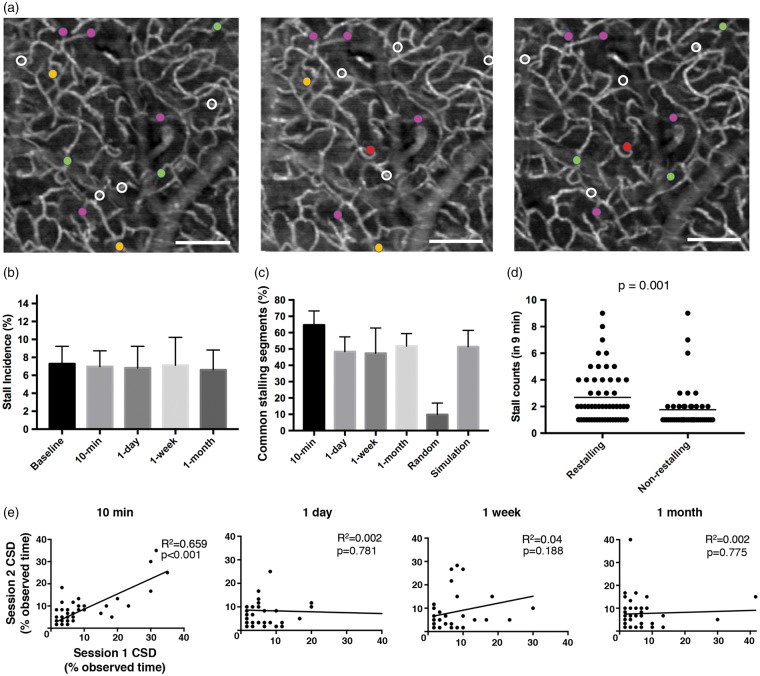
Figure 3.
Repeatability of capillary stalls (a) representative angiogram at baseline, at one week and at one month later showing segments that were observed to stall during each session. Stalling segments that are common across different imaging sessions are marked with the same color circle. White circles indicate segments that were only observed to stall in that given imaging session. Scalebar: 100 µm. (B) Comparison of stall incidence in awake mice across different imaging sessions. (c) Percentage of common stalling segments across different imaging sessions defined as the number of common stalling segments divided by the mean number of stalling segments in the two imaging sessions. No significant difference was observed between imaging sessions, but 10-min recording intervals had a higher percentage of overlapping segments. Common stall percentages were high compared to a random model of stall overlap percentage. Prediction of overlapping segment percentage by our model of stall kinetics matched the actual measured common stalling segment ratio, indicating that the same capillaries stall in repeated imaging sessions. (d) Re-stalling segments have a significantly higher stall frequency compared to non-restalling segments. (e) Cross-correlations of stall counts for the overlapping segments between repeated recordings at 10 min, one-day, one-week and one-month intervals. We observed a weak but significant correlation in the overlapping segments for the 10 min repeated recording but there was no correlation for the longer intervals, which may explain the relatively higher percentage of common stalling segments observed in 10-min repeats.

