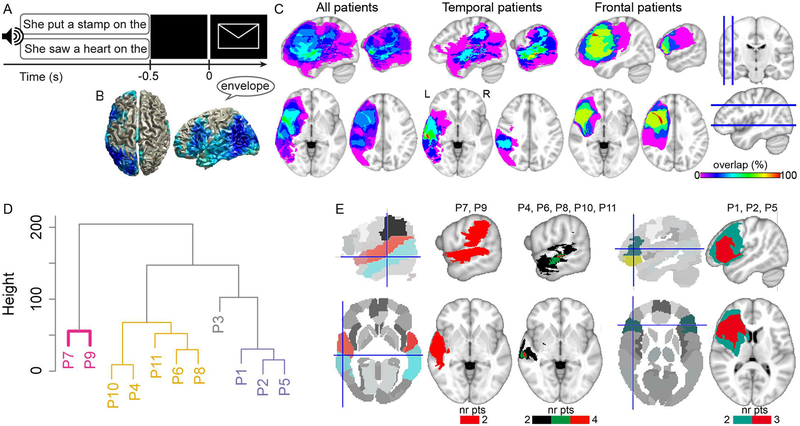
Figure 1.
A. An example of a trial with constrained (upper) and neutral (lower) sentence contexts with auditory sentences and visual pictures. Only one sentence was presented per trial. B. Source localisation of the alpha-beta context effect of Piai et al. (2015). C. Lesion overlap map of all patients (left, N = 11), patients with predominantly temporal lobe lesions (middle, N = 6), and patients with predominantly frontal lobe lesions (right, N = 5). The color scale indicates the amount of overlap in lesion location, with magenta indicating that only one patient has a lesion in that particular region (i.e., 0% overlap) and red indicating that all patients have a lesion in that location (i.e., 100% overlap). D. Dendrogram of the lesion clusters over left superior temporal, middle temporal, angular, supramarginal, and inferior frontal gyri. Significant clusters are indicated by colours. E. Parcellated brains, with relevant regions of interest in colour, and lesion overlap of patients in each cluster (from D), thresholded at where lesions overlap in at least two patients (nr pts = number of patients). Crosshairs indicate left middle temporal gyrus (left) and left inferior frontal gyrus (right).

