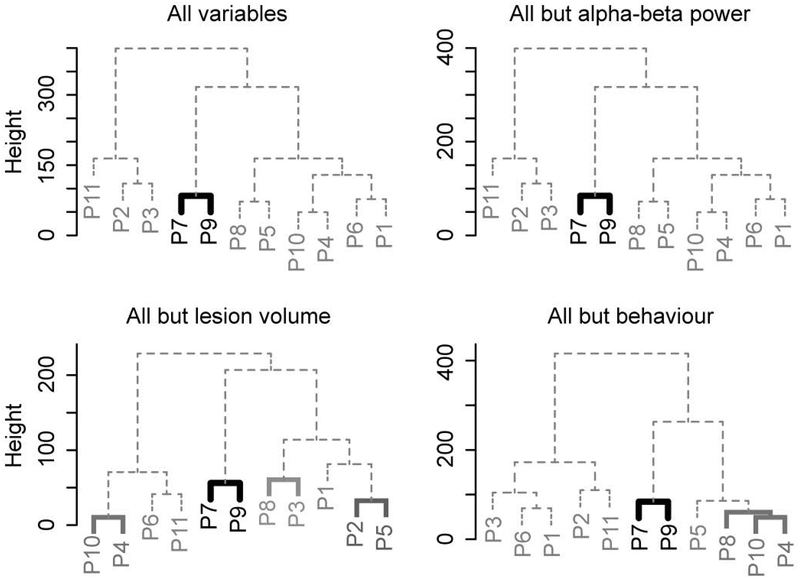
Figure 4.
Dendrograms of the patient clusters for all functional (EEG, behaviour) and anatomical (percent lesion in regions of interest, lesion volume) variables (top left), all variables but EEG (top right), all variables but lesion volume (bottom left), and all variables but behaviour (bottom right). Significant clusters (at an alpha level of .0125) are indicated by colours.

