
Figure 2.
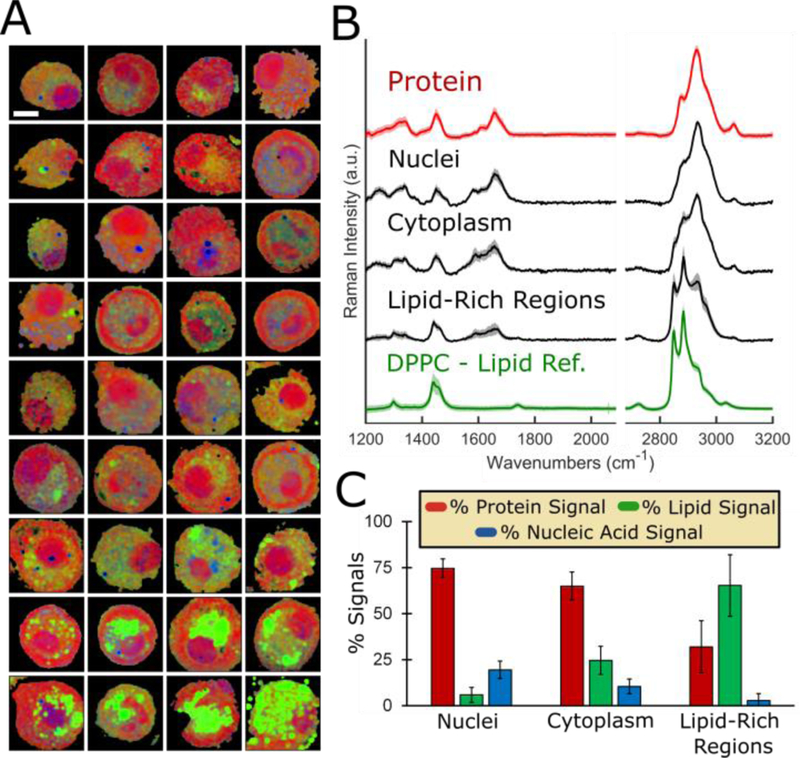
Alveolar macrophages exhibit heterogeneous composition on a per-cell basis. (A) Gallery of 36 cells analyzed with Raman imaging methodology. Scale bar: 10 μm. (B) Extracted average spectra (S.D. shown by shadow) from nuclei, cytoplasmic regions, and lipid-rich regions overlaid with protein and lipid (DPPC) reference spectra (n=25 spectra each group). (C) Regression modelling results for shown extracted spectra (average ± S.D.).