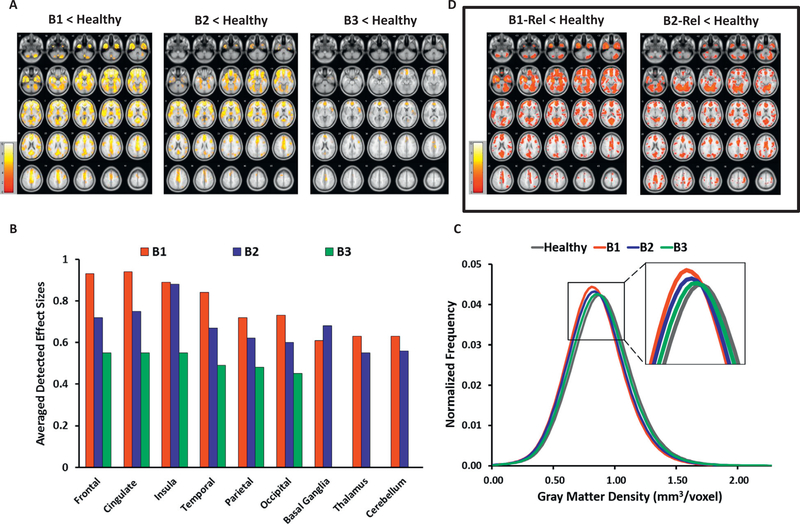
Figure 1.
Gray matter density (GMD) characteristics in probands categorized by Biotype constructs and their relatives, contrasted with healthy subjects. (A) GMD reductions in probands by Biotype vs. healthy controls (HC). The images show voxelwise t maps for GMD reductions in probands grouped by Biotype relative to HC. (B) Regional effect sizes for GMD reductions in probands by Biotype vs. HC. The detected effect sizes are averaged for large brain regions (frontal, temporal, occipital lobes, etc.) across the left and right hemispheres, except for insula (right) and occipital (left) in Biotype 3 probands, where only unilateral effects were depicted. No regional between-group effects in basal ganglia, thalamus, or cerebellum were found in Biotype 3 vs. HC. (C) Whole brain GMD distributions in probands by Biotype and HC. The histogram plots depict within-group distributions of whole brain GMD in probands grouped by Biotype vs. HC. (D) GMD reductions in relatives by Biotype vs. HC (exploratory findings). The images show voxelwise t maps for GMD reductions in first-degree relatives of probands categorized by Biotype, compared with HC. All t maps (A) and regional effect sizes (B) in probands vs. HC are reported at the primary hypotheses-testing threshold (p < .01, familywise error-corrected, k ≥ 20 voxels). All t maps (D) in relatives vs. HC are reported at the exploratory threshold (p < .05, false discovery rate-corrected, k ≥ 20 voxels); the exploratory nature of analyses in relatives is emphasized by the frame in (D). Images (A) and (D) are displayed in neurological convention; color bars indicate the ranges of t values for each between-group contrast. B1, Biotype 1 probands; B1-Rel, relatives of Biotype 1 probands; B2, Biotype 2 probands; B2-Rel, relatives of Biotype 2 probands; B3, Biotype 3 probands.

