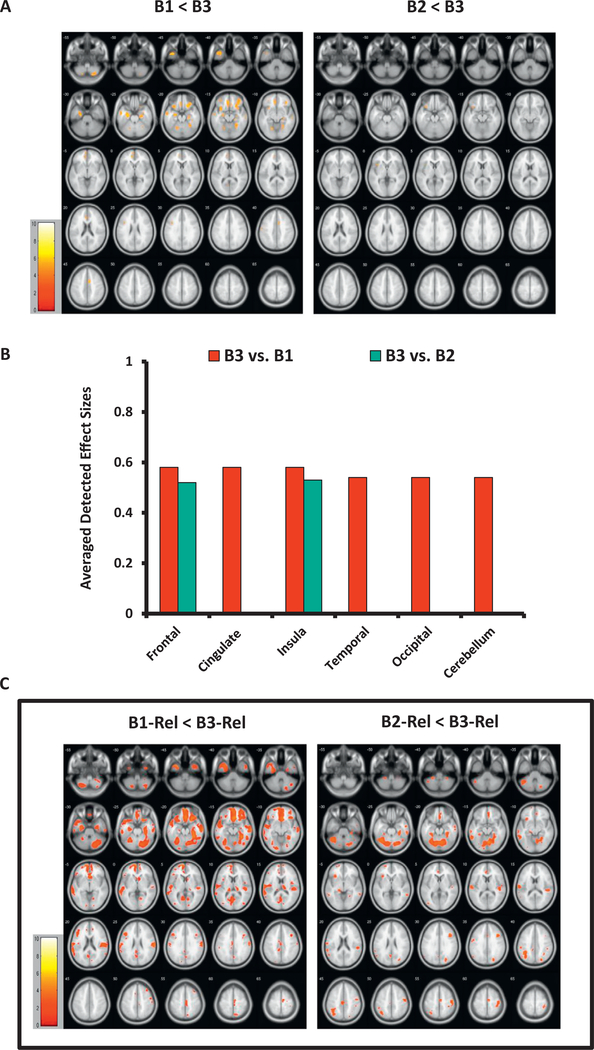
Figure 3.
The Biotype groups’ separation based on gray matter structure biomarkers. (A) Gray matter density (GMD) differences among probands organized by Biotype. The images show voxelwise t maps for GMD differences among probands within the Biotype approach, with lower densities in B1 and B2 relative to B3. (B) Effect sizes for between-group separation in probands by Biotype. Detected effect sizes for B1 vs. B3 between-group differences are averaged for large brain regions (frontal, temporal, occipital lobe, etc.) across the left and right hemispheres; for B2 vs. B3, unilateral effect sizes are reported: frontal (left), insula (left). (C) GMD differences among relatives grouped by Biotype (exploratory findings). The images show voxelwise t maps for GMD reductions among relatives organized by Biotype, with lower densities in B1-Rel and B2-Rel than in B3-Rel. All t maps (A) and regional effect sizes (B) in probands are reported at the primary hypotheses-testing threshold (p < .01, familywise error-corrected, k ≥ 20 voxels). All t maps (C) in relatives are reported at the exploratory threshold (p < .05, false discovery rate-corrected, k ≥ 20 voxels); the exploratory nature of analyses in relatives is emphasized by the frame in (C). Images (A) and (C) are displayed in neurological convention; color bars indicate ranges of t values for each between-group contrast. B1, Biotype 1 probands; B1-Rel, relatives of Biotype 1 probands; B2, Biotype 2 probands; B2-Rel, relatives of Biotype 2 probands; B3, Biotype 3 probands; B3-Rel, relatives of Biotype 3 probands.

