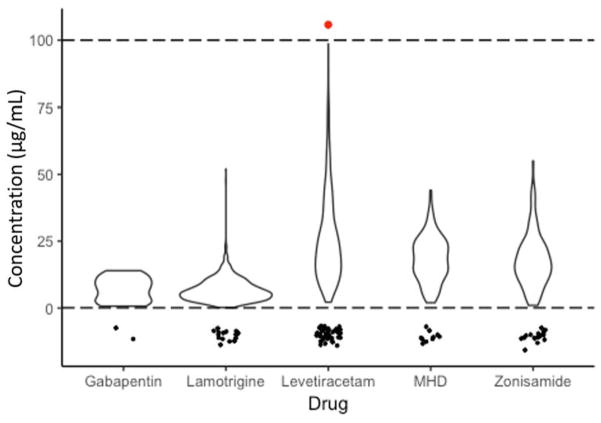
Figure 1. Violin plot of one year of AED TDM values of our patient population determined by a reference laboratory.
Based upon this analysis, lower and upper limit cutoffs of 0.1 and 100 μg/mL, represented by the dotted lines, were subsequently chosen for method development. Values below the reportable ranges of the reference lab assays are represented as points below the dashed line at 0.1 μg/mL to illustrate how many values fell below the reportable range. Note: the x-axis width of the plot at any given value is proportional to the frequency of that value.

