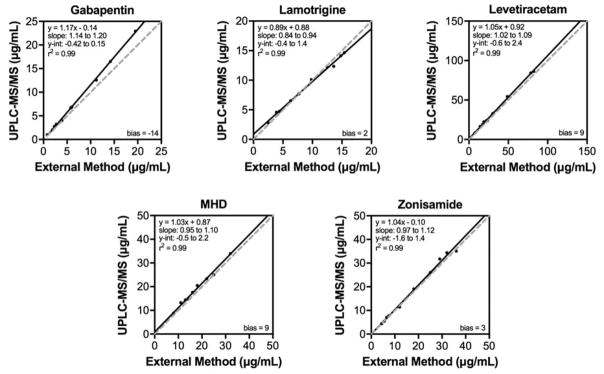
Figure 3. Method comparison.
Drug levels measured by the described U-HPLC-MS/MS TDM assay (y-axis) and levels measured by an LC-MS/MS method at a reference laboratory (x-axis). The equation of the line, slope, y-intercept, and R2 value is displayed for each comparison. Solid line — Deming regression; dashed line — 1:1 line.

