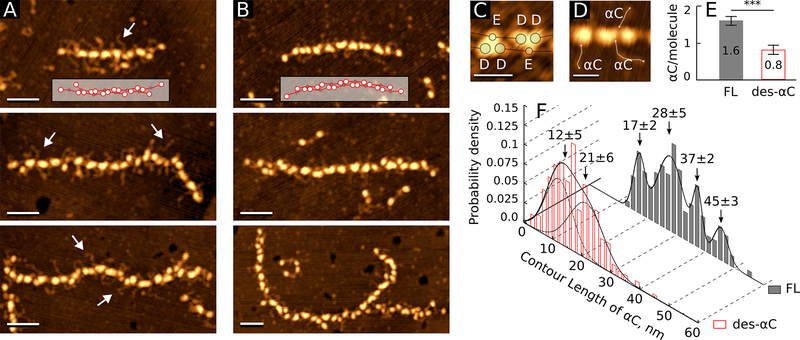
figure 2.
incidence and contour length distribution of the αc regions in fibrin oligomers formed from full-length and des-αc fgs. a: individual fibrin oligomers formed from the full-length fg. an inset shows how fibrin monomers are lined up in the protofibril. white arrows point to the αc regions magnification bars = 50 nm. b: fibrin oligomers formed from the des-αc fg. an inset shows how monomers are lined up in the protofibril. magnification bars = 50 nm. c: two enlarged “heart-shaped” particles showing the dispositions of the globular parts of d and e regions. magnification bars = 20 nm. d: protofibril fragment; the lines show how the contour length of the αc regions was measured. magnification bars = 20 nm. e: the average number of visible αc regions per one monomer in fibrin oligomers formed from the full-length (n=40) and des-αc fgs (n=40) variants (***p<0.001). f: histograms of the αc regions’ contour lengths in fibrin oligomers formed from the full-length fg (n=140) and des-αc fg (n=246).

