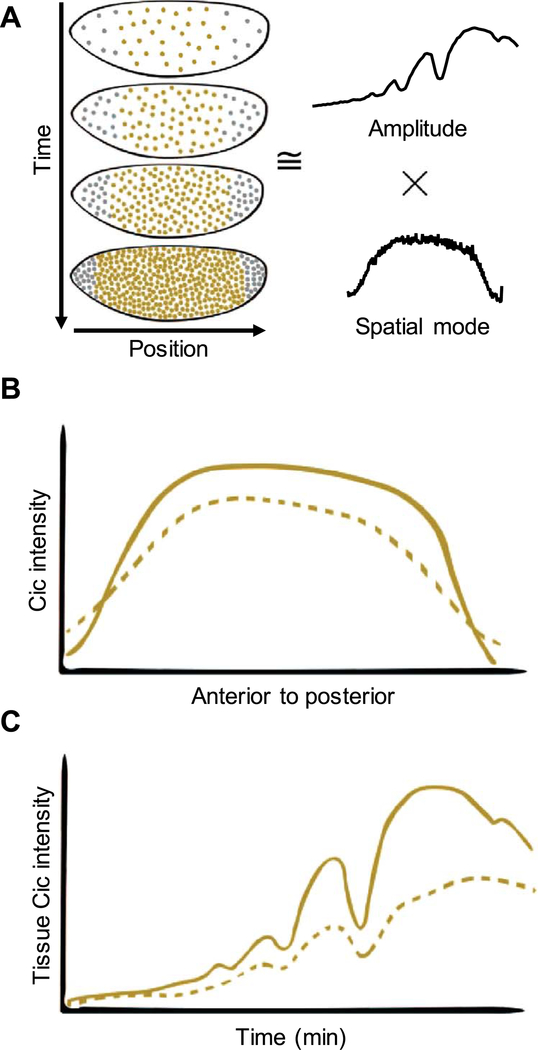
Fig. 4.
Capicua dynamics as a functional assay to analyze the Ras pathway mutations. (A) Low dimensional approximation of Cic dynamics in terms of temporal amplitude and primary spatial mode. (B) Schematic representation of the spatial profiles of Cic intensity for wild type (solid) and MEK mutants (dotted) across the embryo length. (C) Schematic representation of the dynamics of the Cic amplitudes for wild type (solid) and MEK mutants (dotted). Each visible peak corresponds to mitosis in the respective nuclear cycle.

