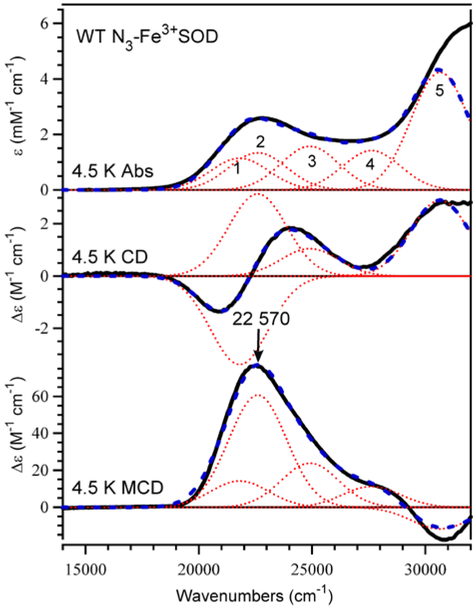
Figure 4.
Abs (top), CD (center), and 7 T MCD (bottom) spectra of N3-Fe3+SOD at 4.5 K. Individual Gaussian bands (⋯) and their sums (---) obtained from an iterative fit are shown for each spectrum. Conditions: [Fe3+SOD] = 1.4 mM, [NaN3] = 100 mM; protein was in 50 mM phosphate buffer (pH 7.0) and 55% (v/v) glycerol.

