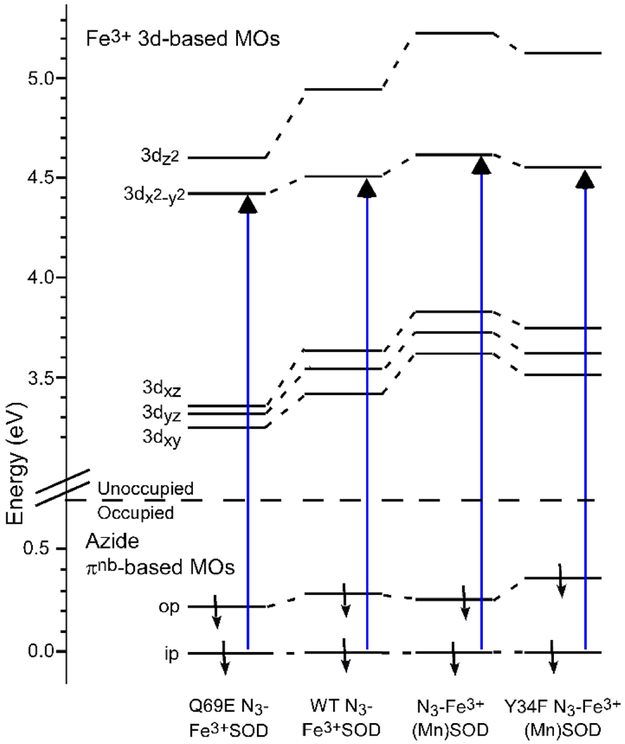
Figure 9.
Relevant portions of the DFT computed MO diagrams for Q69E N3-Fe3+SOD, N3-Fe3+SOD, N3-Fe3+(Mn)SOD, and Y34F N3-Fe3+(Mn)SOD. Only the spin-down MOs are shown, and their energies are given relative to that of the corresponding azide πnb(ip)-based MO. In each case, the N3− → Fe3+ CT transition responsible for the dominant MCD feature in the visible/near-UV spectral region (Figure 5) is indicated by an arrow.

