
Figure 2.
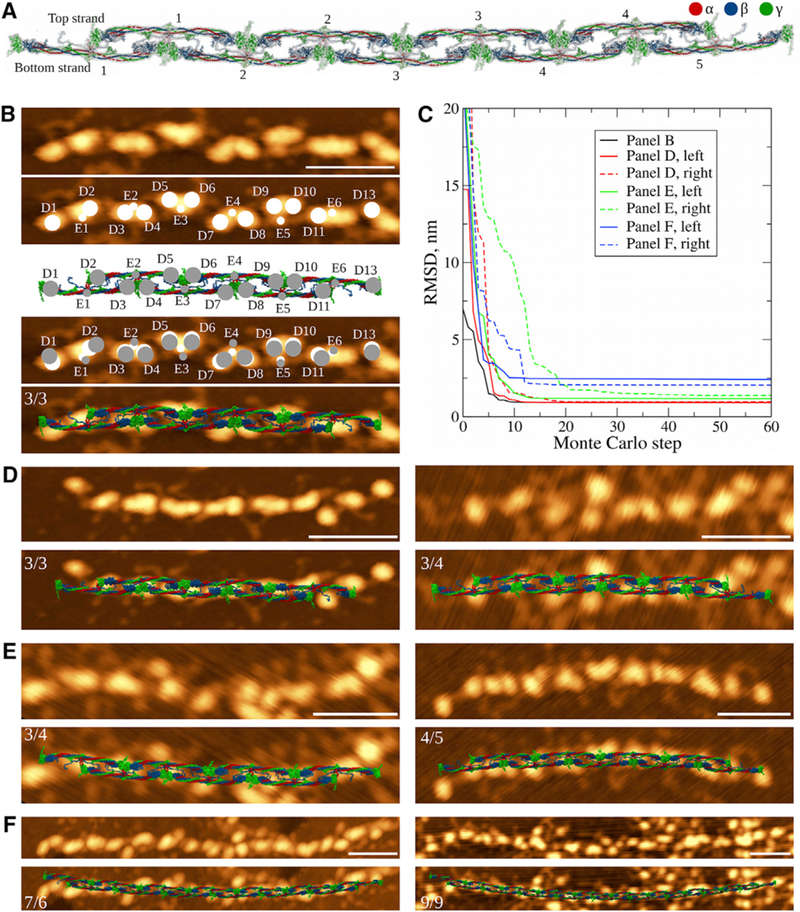
Comparison of Fibrin Oligomer Structures Obtained In Silico and In Vitro (A) Structure of double-stranded fibrin oligomer FO4/5, obtaining using an elongation procedure (Figure 1B) applied to a short fibrin oligomer FO2/3 with the straight conformation of D:D self-association interface (STAR Methods). (B) Monte Carlo method used to overlap the atomic structural models with AFM images. We identify the positions of geometric centers of the globular D and E regions in an AFM image (white circles) and centers of mass of these regions in the atomic structure of equal length (gray circles). Monte Carlo simulations are used to perform rigid-body transformation that minimizes the RMSD between positions of the globular regions (fourth image). Similar transformation is then applied to the atomic structure (last image). (C) Dynamics of RMSD values between the globular regions identified in AFM images and atomic structural models from Monte Carlo simulations. Shown are curves for the structure overlaps presented in (B), (D), (E), and (F). (D–F) Structures of the fibrin oligomers of various length overlaid with the AFM images. Short oligomers (D) show very good agreement with the experimental AFM data. With increasing length of fibrin oligomers reconstructed using the straight conformation of the D:D interface, the agreement becomes worse (E), and structures of longer oligomers (FO5/6 or longer) come short at explaining the overall shape and structural features observed experimentally (F). On each AFM image the numerals indicate the number of fibrin monomers in the upper/lower strands. Scale bars, 50 nm.