Figure 4.

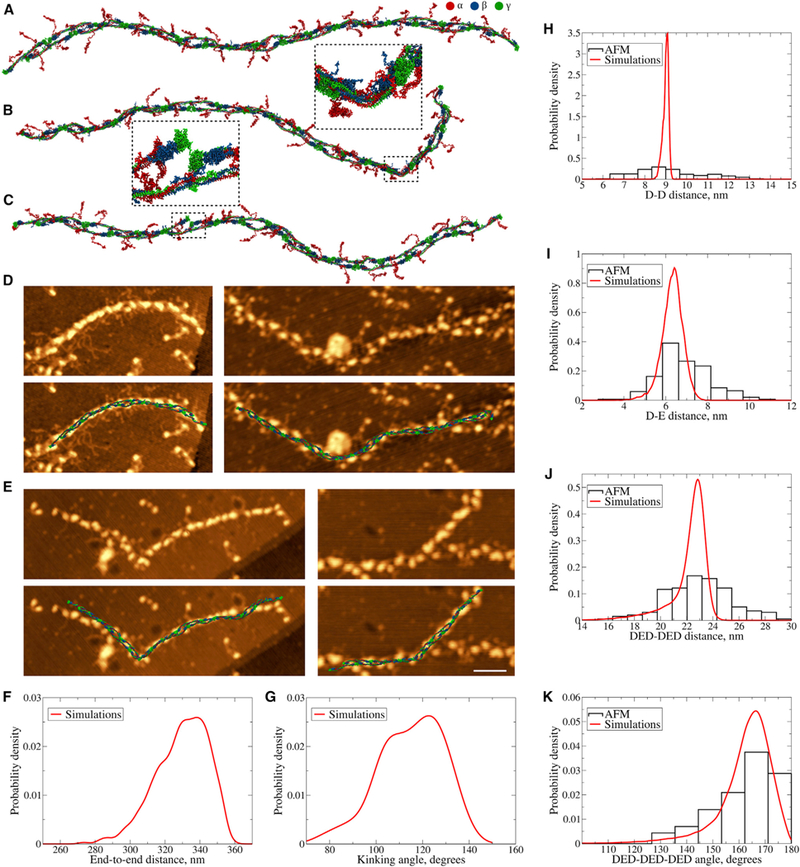
Conformational Dynamics of Fibrin Protofibrils (A) Structure of FP9/10 in a coarse-grained representation used to study the equilibrium dynamics of fibril protofibrils. (B) Structure showing a kink formed in the unstructured regions of α-helical coiled coils in both strands (magnified in the inset). (C) Structure with dissociated A:a knob-hole bond. The A:a knob-hole bond dissociation is followed by the disruption of D:D self-association interface (magnified in the inset). (D and E) Representative high-resolution AFM images of bent fibrin protofibrils (D) and protofibrils with kinks (E) overlaid with the corresponding structures obtained in silico. Scale bar, 50 nm. (F and G) Probability distributions of the end-to-end distances (F, sample size = 1,000) and kinking angles (G, sample size = 51) from equilibrium simulations of fibrin protofibrils obtained using kernel density estimation with the Gaussian kernel (Bura et al., 2009). (H–K) Probability distributions of the distances between two adjacent D regions (H, sample size = 153 for AFM and 100,000 for simulations), between D and E regions in the DED complex (I, sample sizes = 200 and 200,000), between two consecutive DED complexes (J, sample sizes = 173 and 92,000), and probability distributions of angles made by three consecutive DED complexes (K, sample sizes = 129 and 67,000) from AFM experiments (histograms) and equilibrium MD simulations (curves). Theoretical distributions were obtained using kernel density estimation with the Gaussian kernel (Bura et al., 2009). See also Table S2.
