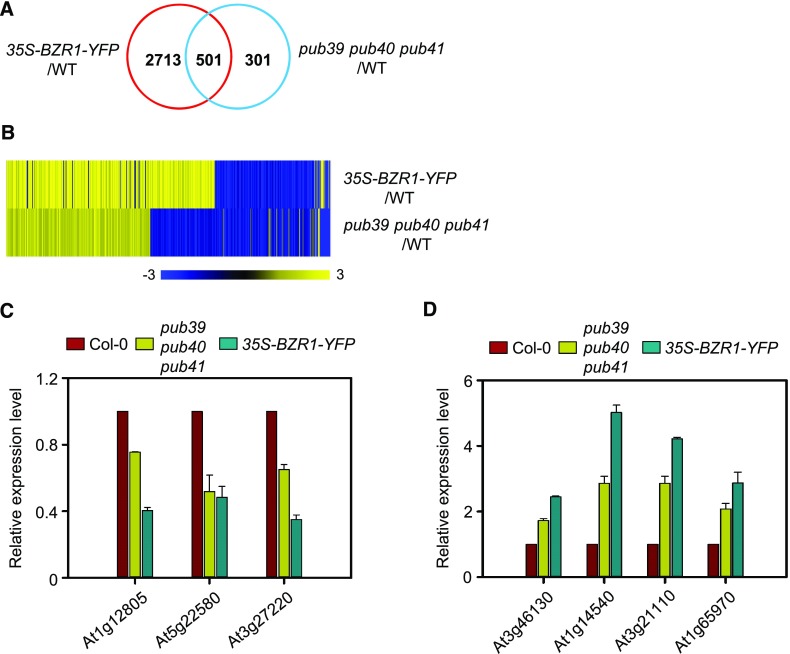
Figure 5.
Comparison of Gene Expression Profiles of 35S-BZR1-YFP and pub39 pub40 pub41 Plants.
(A) Venn diagram of differentially expressed genes in 35S-BZR1-YFP and the pub39 pub40 pub41 compared with the wild type. Total RNA was extracted from whole roots of seedlings grown on MS medium for 14 d. The data were obtained from RNA-Seq analysis.
(B) Heat map of coregulated genes by BZR1 and PUBs. Scale bar = fold changes.
(C) RT-qPCR analysis of BZR1-downregulated gene expression in Col-0, pub39 pub40 pub41, and 35S-BZR1-YFP. Error bars = ±se. The data shown are representative of two independent experiments. Data represent the means from two technical replicates.
(D) RT-qPCR analysis of BZR1-upregulated gene expression in Col-0, pub39 pub40 pub41, and 35S-BZR1-YFP. Error bars = ±se. The data shown are representative of two independent experiments. Data represent the means from two technical replicates.

