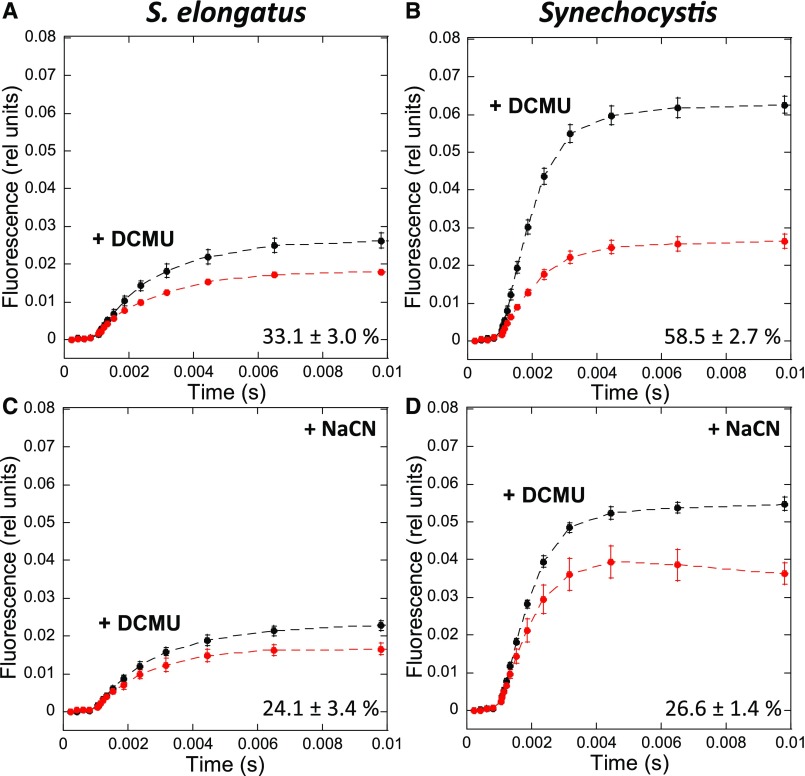
Figure 7.
Fluorescence Induction in the Absence and Presence of NaCN in S. elongatus and Synechocystis Cells.
Whole cells (Chl concentration 2.5 μg/mL) were dark adapted for 15 min at 31°C before illumination with orange light (180 µM photons m−2 s−1).
(A) and (B) Fluorescence induction in the absence of NaCN.
(C) and (D) Fluorescence induction after 3-min incubation in the presence of NaCN (80 µM).
Black lines show fluorescence induction in the presence of DCMU (10 µM). Red lines show fluorescence induction in the absence of DCMU. The detection wavelength was ≥695 nm (far-red). The curves are the average of at least three independent biological replicates. The percentages shown are the area between the curves relative to the area under the curve with DCMU. The errors bars correspond to the sd of the data shown.

