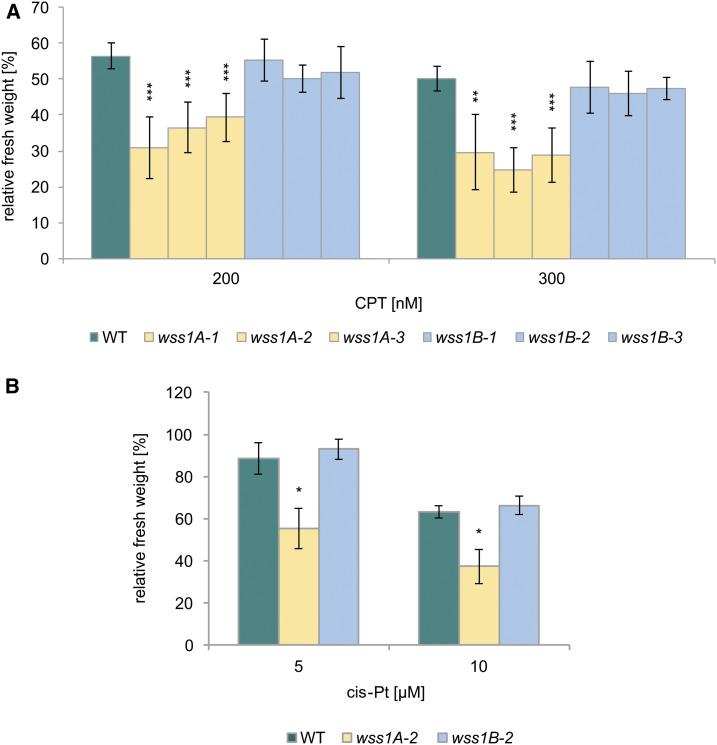
Figure 2.
Sensitivity of WSS1A and WSS1B Deficient Lines Against CPT and Cis-Platin.
(A) Mean values of fresh weights of plantlets relative to untreated controls after treatment with 200 and 300 nM CPT (n = 6). wss1A lines exhibited a statistically significant hypersensitivity in comparison with the wild type (WT) after CPT-treatment in both concentrations used. wss1B alleles were comparable with wild type.
(B) Mean values of fresh weights of plantlets relative to untreated controls after treatment with 5 and 10 µM cis-platin (cis-Pt; n = 3). All cis-platin concentrations tested led to a hypersensitivity of wss1A-2 compared with the wild type on a significant level, whereas a hypersensitivity of wss1B-2 was not detectable.
Columns in (A) and (B) correspond to mean values, and error bars represent ±sd. Statistical differences were calculated using a two-tailed t test with unequal variances: *P < 0.05, **P < 0.01, ***P < 0.001.

