Figure 5.
Analysis of tdp1 Mutant Lines.
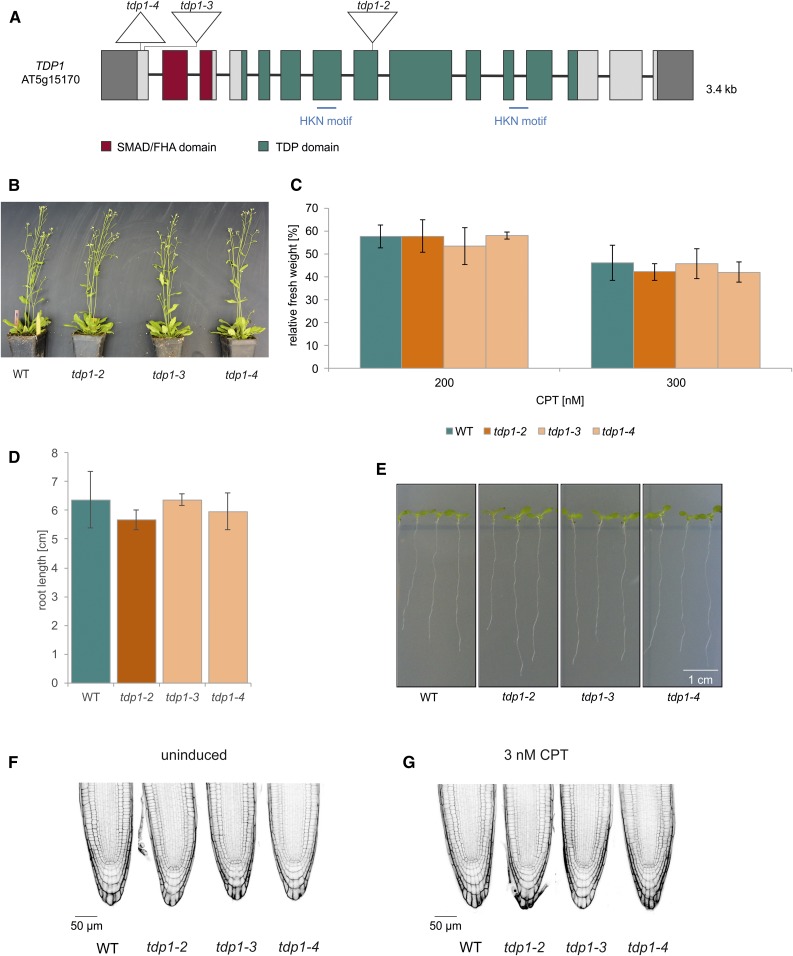
(A) Genomic structure and protein domains of TDP1. AtTDP1 is 3.4 kb, with 15 exons and 14 introns. The mutations introduced via CRISPR/Cas9 in tdp1-3 and tdp1-4 are located in exon 1, harboring a 1-bp insertion and 14-bp deletion, respectively. The deletion in tdp1-4 includes the start codon. The T-DNA mutant line tdp1-2 harbors the T-DNA insertion in exon 8. Untranslated regions are colored in dark gray. SMAD/FHA, an acronym from the fusion of Caenorhabditis elegans Sma genes and the Drosophila Mad (Mothers against decapentaplegic)/forkhead associated. HKN, histidine, lysine and asparagine.
(B) After 7 weeks of cultivation in soil, the growth phenotype of tdp1-2 to tdp1-4 was indistinguishable from wild type (WT) plants.
(C) Mean values of plantlet fresh weights relative to untreated controls after treatment with 200 and 300 nM CPT are shown. None of the three tdp1 mutant alleles displayed any sensitivity after CPT treatment (n = 3). The relative fresh weights of the mutant lines were comparable with the fresh weight of wild type.
(D) and (E) Mean values of root length (of ten roots) measured from 9-d-old seedlings of the tdp1 mutant alleles were on wild-type level (n = 3).
(F) PI-stained root tips of all three tdp1 mutant lines did not reveal a single dead cell out of 30 roots analyzed per genotype. This was also observed with wild-type roots.
(G) PI-stained root tips of tdp1-2 to tdp1-4 and wild type were analyzed after induction with 3 nM CPT (30 roots per line). TDP1 deficient lines were indistinguishable from wild type, exhibiting less than 1 dead cell per root.
Columns in (C) and (D) correspond to mean values, and error bars represent ±sd. Statistical differences were calculated using a two-tailed t test with unequal variances: *P < 0.05.

