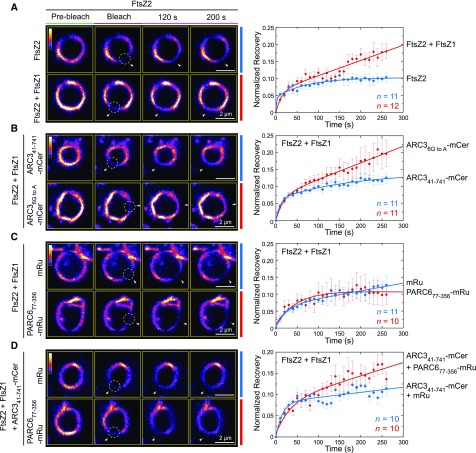
Figure 7.
ARC3-PARC6 Interaction Increases the Dynamics of Z Rings Reconstituted in Pichia.
Pichia cells were transformed with vectors expressing the indicated combinations of FtsZ2-eYFP (FtsZ2), FtsZ1 (unfused), ARC341-741-mCerulean (ARC341-741-mCer), ARC36G to A-mCerulean (ARC36G to A-mCer), PARC677-356-mRuby2 (PARC677-356-mRu), and mRuby2 (mRu). In strains expressing more than one protein, all constructs were expressed from a single vector.
(A) to (D) FRAP analysis of the FtsZ2-eYFP signal in Pichia cells expressing the indicated proteins. Recovery of eYFP fluorescence was recorded for 270 s following photobleaching. Fluorescence images in the left panels show Z rings prior to photobleaching (Pre-bleach), at the time of photobleaching (Bleach), and at 120 and 200 s after photobleaching. Circles and arrowheads indicate the photobleached regions. The color scale bar indicates the FtsZ2-eYFP fluorescence intensity from white (highest) to black (lowest). Bars = 2 μm. Panels on the right show recovery curves. A two-binding-state equation was used to conduct curve fitting using averaged recovery data (Sprague et al., 2004; Yoshida et al., 2016). The resultant parameters are summarized in Supplemental Table 2. n is the number of cells used to obtain the averaged FRAP data for each experiment. Error bars represent sem at the indicated time point.

