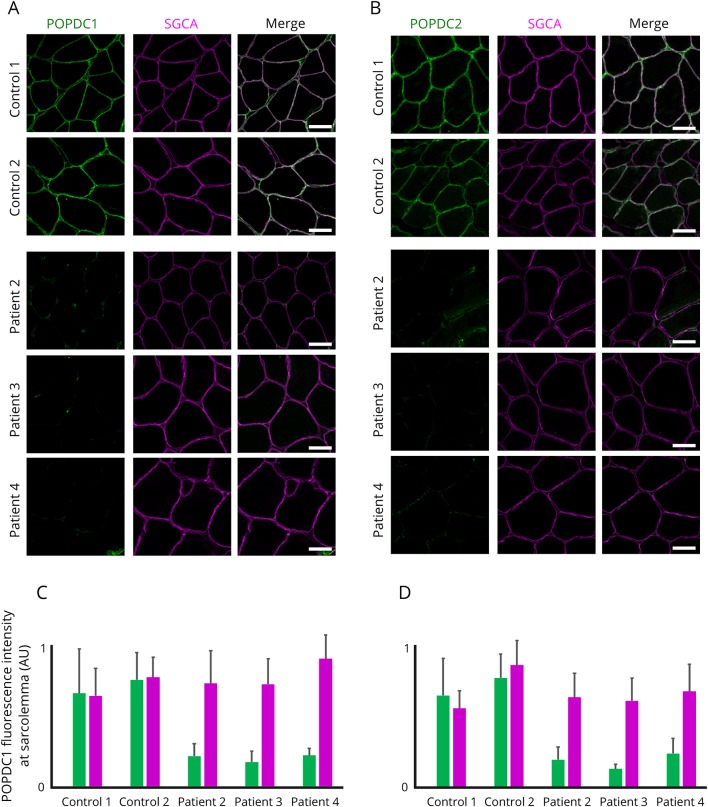
Figure 4. Reduction of POPDC1 and PODPC2 at the sarcolemma in muscle of patients harboring homozygous mutations in BVES.
(A and B) Representative muscle sections of patients and controls immunostained for POPDC1 and POPDC2, respectively, and α-sarcoglycan (SGCA) as sarcolemmal marker. All images were acquired with identical settings and are displayed in the figure with identical intensity scaling for each channel. Scale bar = 50 μm. (C and D) Fluorescence intensities measured at the sarcolemma (n = 30 sarcolemmal segments at random positions on the section). AU = arbitrary unit.

