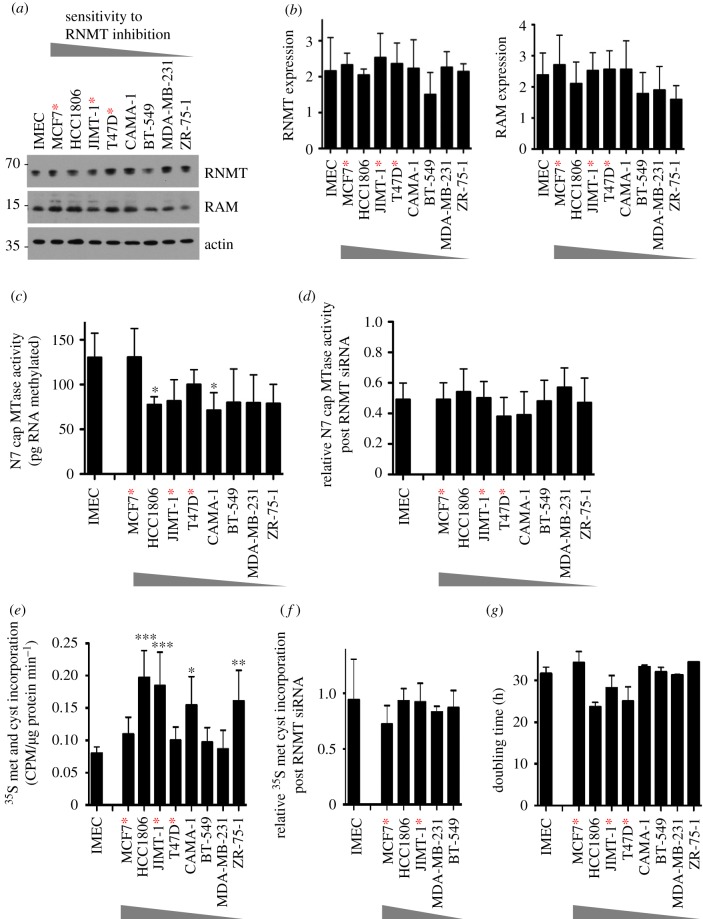
Figure 3.
RNMT dependency does not correlate with RNMT expression or activity, the rate of protein synthesis or the rate of cell proliferation. (a) Levels of RNMT and RAM in log-phase cell extracts were analysed by western blot. Blots presented are representative of four independent experiments. (b) RNMT and RAM band intensities were quantified using ImageJ software. The bar charts depict average band intensity and standard deviation for four independent experiments. (c) N7 guanosine cap methyltransferase activity was determined in cell extracts using an in vitro assay. The chart depicts the average cap methyltransferase activity and standard deviation for four independent experiments. (d) N7 guanosine cap methyltransferase activity was determined in cell extracts 48 h after transfection with RNMT siRNA1 and expressed relative to values in control cells. (e) The rate of 35S methionine and 35S cysteine incorporation into cellular proteins was determined for log-phase cells. The chart depicts the mean and standard deviation for incorporation of amino acids per µg of cellular protein per min of assay reaction, for three independent experiments. (f) The rate of amino acid incorporation was determined in cells 48 h after transfection with RNMT siRNA1 and expressed relative to values in control cells. (g) The doubling time of log-phase cell lines determined. For charts, statistical significance was assessed using ANOVA followed by Dunnett's multiple comparison tests in comparison with IMEC values: *p ≤ 0.05; **p ≤ 0.01; ***p ≤ 0.001. Cells expressing oncogenic PIK3CA mutants are indicated with red asterisks.

