Figure 5.
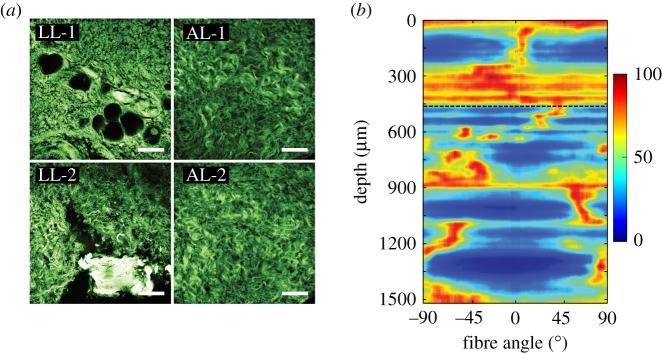
SHG images and intensity plot for a tissue taken from an abdominal aortic aneurysm (AAA-4, see fig. 8b of Niestrawska et al. [49]): structure of luminal layer (LL-1 and LL-2), and abluminal layer (AL-1 and AL-2), of two patches taken from adjacent locations. Image LL-1 shows bright ‘stains’ representing a degenerated collagen structure, and image LL-2 indicates a different structure with calcification and wavy collagen fibres. The AL patches are similar to those of a healthy layer. The intensity plot (b) exhibits a highly disturbed structure for the upper 450 μm and an adventitia-like structure with generally two fibre families in the remaining wall thickness. The intensity plot starts at the top with the LL. Scale bar is 100 μm. (Online version in colour.)

