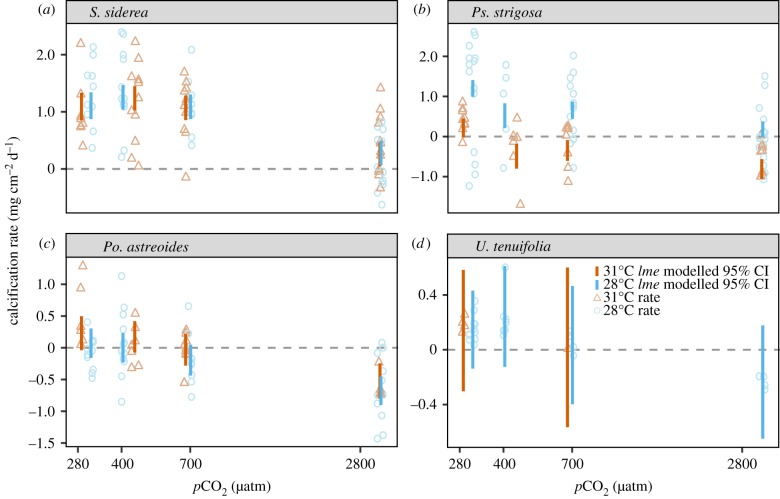
Figure 1.
Net calcification rates (mg cm−2 day−1) for S. siderea (a), Ps. strigosa (b), Po. astreoides (c) and U. tenuifolia (d) cultured over a range of pCO2 and temperature conditions. Blue circles represent net calcification rates for fragments in the 28°C treatments and orange triangles represent net calcification rates for fragments in the 31°C treatments. Blue and orange vertical bars represent modelled 95% confidence intervals (CI) for each pCO2 treatment at 28°C and 31°C, respectively.

