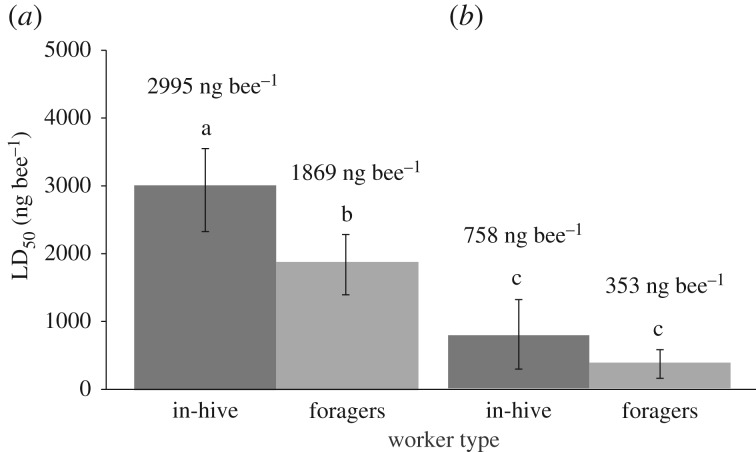
Figure 2.
The LD50 (48 h) of bees exposed to FPF (a) and FPF + PRO (b) across worker types (in-hive bees versus foragers) in summer. Above each bar, we show the LD50 values. Different letters indicate significant differences. We show the 24 h LD50 of foragers (light grey bars), because high summer forager mortality at 48 h prevented the accurate estimation of their 48 h LD50 (standard LD50 estimation time, dark grey bars). Error bars represent 95% confidence intervals (noverall = 1080). The LD50 of FPF across season and worker type is reported in electronic supplementary material, figure S1.

