Figure 2.
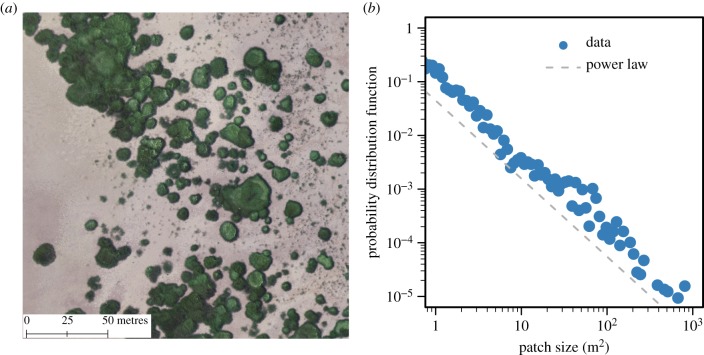
(a) A typically spatial distribution of patches showed an apparently irregular vegetation pattern in the studied intertidal salt marsh ecosystems. The vegetation patches (dark green) are extracted from the aerial photo taken by an unmanned aerial vehicle in July 2018. More data analysis is shown in electronic supplementary materials. (b) The power-law-like patch-size distribution (b = −1.45, R2 = 0.92, p < 0.001) confirmed the irregular pattern, as opposed by Gaussian distributions indicating regular patterns.

