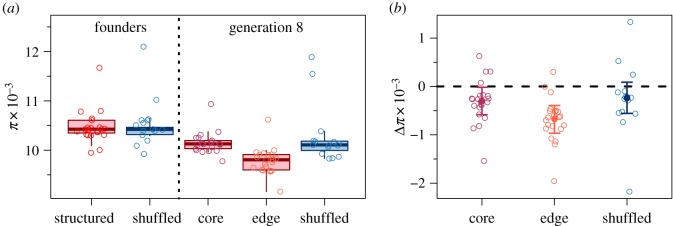
Figure 1.
Autosomal nucleotide diversity contained in founding and generation eight populations. Mean nucleotide diversity (π) across autosomes for all experimental populations is shown in (a). The derived data (mean π across windows) are plotted as individual points and distributions among replicates are shown with standard Tukey box plots. Differences in mean autosomal π from founders to generation-8 populations of the same landscapes are shown in (b). Differences were calculated as the generation-8 value minus the founding population from the same landscape, so a negative value indicates a loss of diversity. No change is indicated by a horizontal dashed line at 0. Derived data are shown as points and model estimated means and 95% confidence intervals are shown by the solid points and error bars. Edge populations show significantly greater reductions in diversity from the founders compared to core and shuffled populations (parametric bootstrap for the effect of spatial structure: p = 0.03). Sample sizes are 22 for structured landscapes (encompassing the structured founders and core and edge populations from generation-8) and 15 for both generations of shuffled landscapes. (Online version in colour.)

