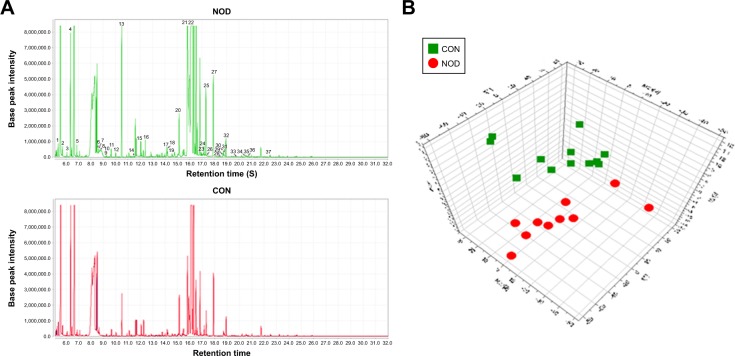
Figure 3.
(A) Representative GC–MS total ion chromatograms (TIC) of the CON and NOD group. (B) Partial least squares-discriminate analysis (PLS-DA) scores plot derived from GC–MS spectra of the CON and NOD macaques.
Abbreviations: CON, control; NOD, naturally occurring depressive; GC–MS, gas chromatography–mass spectrometry.

