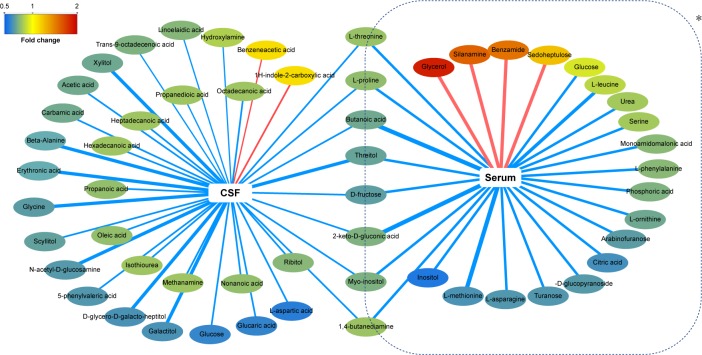
Figure 5.
Network analysis of differentially expressed metabolites in CSF and serum of NOD macaques.
Notes: *The data was from our published work (Xu et al16). Red-colored boxes and red-colored lines indicate upregulation in NOD macaques compared with control (CON), while green-colored boxes and green-colored lines indicate downregulation. The width of the line represents the VIP scores of differential metabolites.
Abbreviations: NOD, naturally occurring depressive; CSF, cerebrospinal fluid; VIP, variable importance in the projection.

