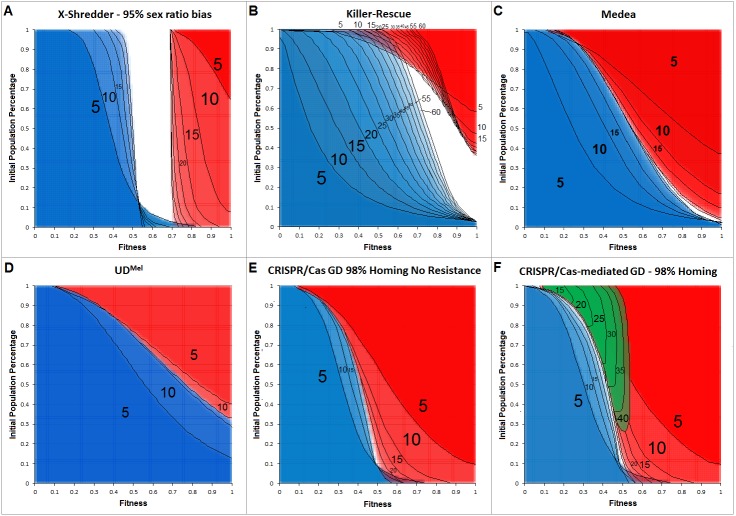
Figure 4. Cross section overlays of fitness and initial release population percentage for different gene drive techniques.
Red, wild type population percentage below 5%; Blue, wild type population percentage above 95%. Green, population homozygous for resistance alleles above 95%. Black numbers and lines represent the respective generation post-release. Black lines were inserted by hand for clarity.

