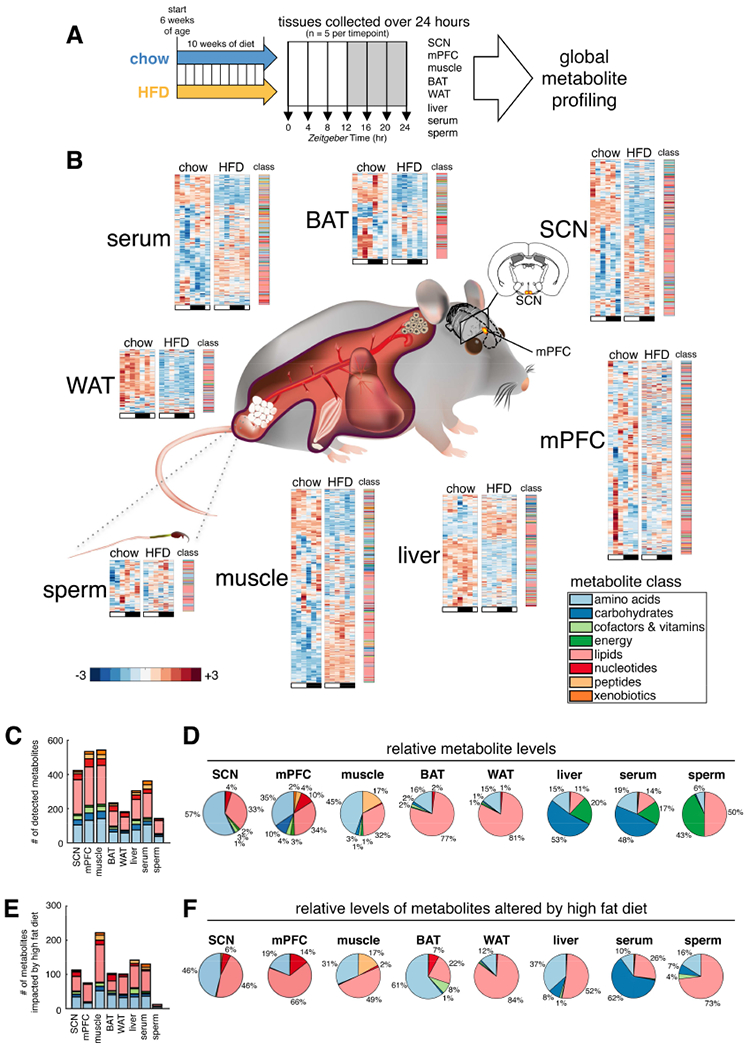
Figure 1. Global metabolite profiling of mouse tissues over 24-hours reveals common and tissue-specific metabolic signatures on chow and HFD.

(A) Experimental design. Suprachiasmatic nucleus (SCN), medial prefrontal cortex (mPFC), gastrocnemius skeletal muscle, interscapular brown adipose tissue (BAT), epididymal white adipose tissue (WAT), liver, serum, and cauda epididymal sperm collected every four hours across the light/dark cycle from a single cohort of C57BL/6J mice. 6 time points were profiled for SCN, mPFC, muscle and sperm; a 7th replicate time point, ZT24, was additionally profiled for serum, liver, BAT and WAT.
(B) Tissue-specific metabolite heatmaps. Rows reflect normalized (z-score) metabolite abundance across the light/dark cycle (white bar=ZT0, 4, 8 & 24; black bar=ZT12, 16 & 20). Metabolite class is indicated at the right of each heatmap.
(C) Counts and class of detected metabolites for each tissue.
(D) Tissue metabolite class composition according to relative metabolite masses (sum of standardized abundances).
(E) Counts and class of metabolites significantly impacted by diet (diet effect p<0.05, linear regression model).
(F) HFD-altered metabolite class composition for each tissue. (relative metabolite masses affected by HFD).
